|
|
|
|
MARI News Press Releases Blogs&Lists About Us Newsletter Disclaimers |
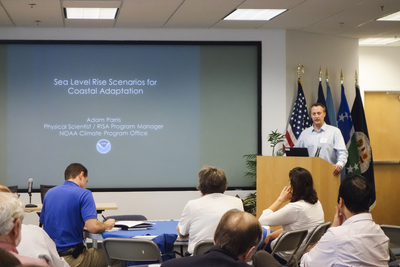
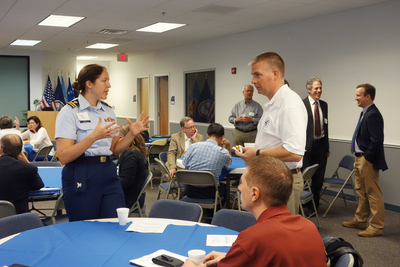
Fall 2014 meeting of the Hampton Roads Sea Level Rise/Flooding Adaptation Forum
Michelle Covi
|
On September 19, 2014, the Hampton Roads Adaptation Forum brought together scientists, municipal planners and managers, federal/state agency representatives, business people, and NGO representatives to discuss coastal adaptation and preparedness. Over 65 people met at Old Dominion University’s VMASC (Virginia Modeling, Analysis and Simulation Center) facility in Suffolk to discuss flooding and sea level rise assessment tools. This was the sixth meeting of its kind since 2012, when Virginia Sea Grant, Old Dominion University (ODU) and the Hampton Roads Planning District Commission (HRPDC) first worked to build a regional network of professionals to share climate adaptation information and lessons learned. The meeting commenced with a brief welcome by HRPDC’s Ben McFarlane and a short report about which sea level rise/flooding viewers registrants to the meeting use and how they are used by Michelle Covi of ODU and Virginia Sea Grant. After introductions from ODU’s Larry Atkinson, the presentations kicked off with a presentation by Adam Parris, program manager from the NOAA Climate Program Office, about the National Climate Assessment. Parris’ focus was on the approach and methods used to develop the sea level rise scenarios for the national assessment that have ultimately been used in many of the sea level rise risk viewers. The national assessment is an inter-agency effort and an attempt to build resilience, not by providing a projection or a prediction of the future, but by developing possible future levels that decision-makers can use in different planning situations. Scenario-based planning was developed by the military to plan for a range of futures and a relative wide range of futures was used to increase the confidence level expressed in the report. The information from the National Climate Assessment is already being used in places like Maryland, where the state convened a panel to re-examine their adaptation plans. The information from the Assessment was also used as part of the Hurricane Sandy recovery in cases where cities, such as New York were interested in rebuilding to increase resilience to future sea levels. In 2013 it was used to write 13 local laws, and was a part of local hazards mitigation plans, levee and beach replenishment designs, factored into Con Ed rate case testimony, and used in plans for restored wetlands and building tidal barriers. Parris said, “Resilience is a process. Resilience is this meeting. It is learning, cooperation, science and exchange. It is using a diversity of approaches including hard and soft, green and gray. You can use the information from the assessment at the local level as a way to engage the federal government to create a smoother path for implementation. “ Tom McNelian spoke briefly at the break about the Dutch Dialogues, a series of talks sponsored by the HRPDC, the Embassy of the Netherlands and McNeilan & Associates. McNeilan explained the process, which includes identifying the stakeholders, meeting them to understand their needs and developing a workshop agenda similar to a planning charrette. He noted that the Dutch are familiar with the challenge of living on low-lying land near the water and eager to help other communities. He said, “ The Dutch view water as the location where environment meets the economy,” a frame of reference that can be very helpful for Hampton Roads. Ben Strauss, Director of the Program on Sea Level Rise for Climate Central presented their Surging Seas viewer, which rolled out its Virginia update earlier in the week. Strauss noted that the Virginia map use LIDAR at 1 meter horizontal resolution, and is an example of a place where they fill in gaps in information that is not available on the NOAA sea level rise viewer. He explained that each of the viewers are complimentary and that Surging Seas has value-added tools that do not exist at the NOAA viewer. While they use national data, they have techniques to localize it and have the ability to create easy and quick reports and summaries. A detailed explanation of the peer-reviewed methodology is available and all of the data is downloadable. Strauss demonstrated the viewer including the map tools to view demographic data and threats to Virginia Beach. He demonstrated the comparison module and explained that Climate Central is beginning a custom analysis service for a small fee that would allow a locality to use their data within the viewer. Gwynn Critchton demonstrated The Nature Conservancy’s Coastal Resilience Tool. The tool is built with locally specific data to solve specific question and problems that a community is facing. The goal of the organization is to bring science, information and action together to reduce risk to coastal hazards. Their tool helps identify nature-based solutions, such as salt marshes, mangroves, sea grass areas, and riparian forests to build resilience to natural hazards. The tool can help support decisions and then measure the effectiveness of the actions taken. Where the tool has been built out, it can be used at multiple scales. It is global in scope, but built with local information and participation. Besides the mapping, there are apps that are configurable, customizable for the specific region. Infographics help users to analyze and understand the data. Other features are split screen, different base maps, SLAMM models, and reporting features that help users to track progress over time. Critchton explained that the Virginia Eastern Shore region will use the tool to design and monitor coastal restoration efforts and look at the future of barrier islands and inlets. They will work with stakeholders to make the tools relevant and applicable to the local community starting in November. Molly Mitchell from the Virginia Institute of Marine Science presented the Comprehensive Coastal Resource Management Tool, which was originally designed to address shoreline best management practices, but now can serve as a sea level rise assessment tool at the local level. The LIDAR data in the tool is the most up to date available in Virginia and as new data becomes available, the portal is updated. The interface is designed for public consumption and decision-making. Sea level rise is part of the county toolbox. Users can look at different management options and compare their shoreline to existing structures, which have all been mapped. Users can find their property, add sea level rise and use a swipe tool to compare past and present. There is also the option of looking at marshes at risk. Future data to be added to the portal includes social vulnerability information, Mitchell said. Brad Ball, leader of the Center for Operations Directorate GIS team at NASA Langley presented the flood impact analysis tool that his group has developed for their campus, the Langley Ari Force Base, the city of Poquosin and Fort Monroe. They found through experience that every storm generated questions to their group, so they designed a portal that was accessible to employees, now behind a firewall, Ball said. The interface has been functional for about 10 years and has allowed users to analyze impacts and threats to infrastructure. There is the ability to switch datums between mean high water, higher high water and other option. They have measured first floor elevations. Other critical elevations, sewage pump stations, steam tunnels and other systems that need to be shut down in a potential flood to protect equipment. They have about 100 web-enabled services and have validated models of storm surge using local tide gauges. The interface is linked to National Weather Service so that real time precipitation and tidal cycles are can be fed into the models. They have used the tool to inform VDOT about changes to bridge and road design, Ball said. They even have information about the number and size of sandbags available in locations to help with storm preparation. Following the presentations a short discussion period allowed forum participants to ask questions of the panel of viewer presenters about the comparative capabilities and availability of data within the tools. They asked “How do we get this all to work together?” While no one could be definitive about where the future of these tools would go, the possibility of bringing them into tools more familiar to public users, such as Google Earth or Google Maps was discussed. |
|