Fall 2018: Natural Hazards and Disasters
Natural Hazards and Disasters
Class PagesCONTENTS
Class 1: Introduction to the Course and Basic ConceptsCONTENTS
PRACTICALITIESThe main communication tool for this class is the web page at http://www.mari-odu.org/acdemics/2018f_diasters. The main page informs about requirements, work skills, grading, and the grade forgiveness policy. A separate page is available for all legalities. The class schedule is the page where all notes, dates, date lines and assignments will be published. This page also gives access to the individual class and lab pages, which serve as a kind of script. The Get Woke - Stay Woke page is the place where all of you will contribute to the classes and labs. Your presence in the classes and labs will be documented through the submission of 4+4 forms, which can only be submitted during the classes and labs. You will submit separate forms for classes and labs. In theses forms, you will tell me two things you learned and two things you did not understand in the class or in the lab. This will help me to make sure that things I did not explain well enough can be discussed again in the next class/lab. In the 4+4 Forms for the classes, you will also identify two aspects of what was discussed in the class that you think are working very well and two things that you consider as a challenge or unsolved. For the labs, you can leave these fields empty. Active participation in the class is important. The 4+4 Form is one avenue for this. The Get Woke - Stay Woke page provides more tools for active contributions. When you consider something important, you can “Pin It”. The statements you pin are visible to everybody and others can comment on them. I will use your pinned statements to compile key points of the classes and may comment on them. If you have questions related to natural hazards and how humanity is handling the disaster risk, you can “Ask It”. Your questions will be visible to all in the class, and all will be able to try to respond to your questions. I will moderate the deliberations and comment where necessary. I am working on adding more tools to this page. We'll see how this evolves through the course of the class. To access the Get Woke — Stay Woke page, you use your email. The first time you access the page, you will have to enter a password, which you will then have to use whenever you return. If you forget your password, please let me know and I will have to reset it. Note that all assignement will have to be sent to me by email. I will return the assignments with my comments to you. Please, make sure that you read these comments and take them into account for future assignment. The points you get for each assignment will be made available in Blackboard. COURSE CONTENTSHumanity is embedded in, and interacts with, the Earth's life-support system (ELSS) (Griggs et al., 2013, Pearce, 2010). The ELSS provides the basis for the welfare of all human and non-human communities, and these communities are adapted to prevailing conditions. Hazardous events can change these conditions and cause damage to the communities, with the impacts ranging from local, individual to global scale. For humans, reducing disasters caused by hazards is a goal and a necessity to improve sustainability of human communities. Disaster reduction, or better, Disaster Risk Governance (DRG), requires a thorough understanding of the hazards that can occur, the probability of them occurring, and the processes that can lead to disastrous impacts on human and non-human communities. Although the class is titled “Natural hazards and disasters,” it needs to be emphasized that the distinction between natural and anthropogenic hazards is somewhat arbitrary. It would work if humans were in a spaceship and Earth was free of humans. Humanity is an integral part of the ELSS and is modifying the ELSS at a very significant level, and this leads to many hazards that seem to be “natural” but are actually to some extent caused or amplified by humans. The boundary between hazards of non-human and human origin is blurred. Technological hazards can be triggered by non-technological hazards. Human activity can trigger hazards or change the spectrum of hazards in terms of frequency and magnitude. Human activity can also lead to the ELSS crossing thresholds and entering new states with significantly different characteristics and mal-adaptation. The interdependency of human and non-human hazards will be discussed in detail. Hazards and disasters are linked by processes in the exposed community and its environment that are triggered by a hazardous event. These processes depend on how the community is organized and developed, and the same hazardous event can lead to a wide range of disasters depending on the exposed community's preparedness and adaptation. Understanding the processes that link hazards and disasters is a prerequisite for DRG. The class will analyze these processes based on case studies. First, we will briefly introduce the ELSS as the basic conceptual model for sustainability. We will then introduce core concepts and terminology, including hazard, vulnerability, disaster, threshold, resilience, etc. International efforts to address disaster risks including the Sendai Framework and the United Nations Sustainable Development Goals (SDGs) will be briefly mentioned at the beginning of the course, and we will come back to them at the end. The main part of the course will focus on the different natural hazards and the impact they have on humanity. We will also discuss towards the end of the class how humanity it interfering with natural hazards and in some cases amplifying them. The Earth’s Life-Support System and SustainabilityA sustainable development is a development that “meets the needs of the present, while safe-guarding the Earth’s life-support system, on which the welfare of current and future generations [of human and non-human animals] depends” (Griggs et al., 2013). Human (and non-human) communities are embedded in the ELSS and interact with the ELSS through flows. For modern human societies, the flows are part of the economic system and controlled by ethical, moral and economic rules. Over the last 200 years and particularly the last 70 years, most of the flows between the ELSS and humanity have increased by several orders of magnitude and new flows have been created. This has impacted the physiology of the ELSS and threatens the sustainability of modern society. Sustainability is an emerging characteristic of a dynamic system; it is not built into a system by design. It characterizes the ability to maintained the relationships in the system and function continuously. What systems are we referring to? We consider biological, social and economic systems, communities, including whatever technical support the community may have developed. The term “sustainability” is a neutral term and is neither positive nor negative. Applied to society and society's relationship to the Earth's life-support system sustainability needs to be attached to a value system. This also applies to how we handle risk and an active value system is a fundamental incredience to DRG. We will discuss the ethics of DRG and how it relates to the relationship between human communities and the ELSS. Important for DRG is the perception of risk. Realizing that risk perception is a social construct, we have to ask how this social construct is created. The role of cognitive biases at the individual and community level will be an important aspect to consider. While science can inform us about the hazards and the likelihood of hazardous events occuring and engineering can help to understand how the built environment is going to respond to hazardous events, and while social science creeates knowledge about how the social fabric reacts to these events, DRG also depends on our interpretation of evidence and our decision making. Thus, understanding the link between hazards and disasters requires also an understanding of human perception and decision making. In the interaction with the ELSS, humans have to make choices about where to settle, how to develop communities and the built environment, how to meet the needs of human communities, and how to prepare for hazardous events. Many of these choices benefit from a risk-based decision-making. For many of the non-human hazards, we cannot change very much the likelihood of the hazard, but we can impact vulnerability and exposure of human communities. Hazards, Vulnerabilities, and DisastersIt is important to distingush between hazardous events and the resulting disasters, and to realize the relevance of the processes that link hazards and disasters. The societal goal of reducing disaster risks requires a deep understanding of the processes that lead to a disaster as a consequence of a hazardous event. HazardsDefinition: A hazard is a change of the system state that can lead to system degradation and/or a reduction of the system's capability to function. A hazard can be a short event (e.g., an earthquake), a longer process (e.g., extinction), or a slow trend (e.g., sea level rise). A hazard can lead to long-term impacts that reduce the sustainability of the system. We distinguish:
The class will introduce these hazards and discuss their direct and indirect relevance for human and non-human communities. The boundary between non-human and human hazards is blured and increasingly, non-human hazards are modified or amplified by human action. Hazards in the Earth system have a wide range of origins. For risk assessments, it is fundamental to understand how likely the occurence of a hazardous event of a certain type and magnitude is. A widely accepted concept for the characterization of a hazard is the probability density function (PDF). The PDF for different hazard types vary widely. Particularly the low-probability end of the hazard spectrum can show very wide variations for different hazards. The potential impact of a hazard as function of its recurrence frequency or time is also helpful for the characterization of a hazard, although the actual impact on communities depends on where the hazard occures in space (and sometimes time) relative to the exposed community. Low-probability, high-impact events, particularly those that are outside our normal experience, are difficult to assess and prepare for, leading to a wide range of views on the risk. VulnerabilitiesDefinition: Vulnerability is the inability of a system to withstand the effects of a hostile environment. Vulnerability is a system characteristic that is not depending on a hazard actually occuring. For example, a building may be vulnerable to shaking of a certain type and magnitude, independent of this shaking actually occuring. Thus, a building may be vulnerable to earthquakes of a certain intensity independent of an earthquake actually occuring at the location where the building is located. If it is located in a geographical area that does not experience earthquakes, this vulnerability does not lead to a risk. However, if the building is located in a seismicly highly active area, this vulnerability leads to a high risk. The term vulnerability as defined above is mainly used applied to the built environment and the non-human environment. In social sciences, “social vulnerability” describes the extent to which a community could be affected by stress, changes or hazardous events. DisastersDefinition: A disaster is the loss of lives and property; often as the result of a hazardous event. Hazardous events that impact a system trigger processes in this system and these processes determine to what extent the combination of a particular hazard and a particular system will lead to a disaster. These processes depend on the vulnerability of the system to the particular hazard, and the ability of the system to function through the disturbance and to recover from the damages. For human communities both the design of the built environment and the social capital of the human fabric determined the processes a particular hazard will trigger and the extent of the disaster this causes. Thus, while there are natural, non-anthropogenic hazards, the extent of the disaster caused by these hazards are to a large extent determined by humans. Therefore, we do not speak of “natural hazards.” Concerning the extent of disaster, we follow Plag et al. (2015) and classify large event as:
Concept of RiskDefinition: Risk is the potential for consequences where something of value is at stake and where the outcome is uncertain. In general, risk means the possibility of loss, including injury. There are many different ways to quantify risk. We will use the product of hazard probability, vulnerability, and value of exposed assets as a quantitative measure of risk expressed in $. Risk is a useful concept for assessing the relevance of hazards, and for a comprehensive risk assessment, the full ”Probability Density Function“ (PDF) of the hazard needs to be considered. The concept of DRG captures this. Disaster risk assessments are an important tool to guide community actions to reduce or govern the risk. However, public and governmental support for DRG depends on risk awareness, which is determined by individual, community, country and cultural biases. In modern societies, the media play an important role for the development of, as well as the biases in, risk awareness. There are fundamental challenges in understanding and communicating risk. The importance of complex interactions in shaping risks is often overlooked. The need for rigerous expert judgement in evaluating risks is not sufficiently acknowledged. The centrality of values, perceptions, and goals in determining both risks and risk governance is not adequately built into risk assessments. A particularly challenging issue is how to account for low-probability, high-impact hazards in the long-tail of the hazard's PDF. “Successful risk assessment requires thinking 'oustide of the box' to avoid failure of imagination, but this is a skill rarely found at the levels of government and global corporations” (Spratt and Dunlop, 2018). In general, risks associated with extreme events are very often severely underestimated. Deliberations of existential risks to human civilization are often very polarized and the role of science in these deliberations is criticized. ThresholdsDefinition: In a system, a threshold is a tipping point at which a relatively small change or disturbance causes a rapid change in the system. A tipping point may be understood as the passing of a critical threshold in an Earth system component (including ecosystems of human and non-human animals), which produces a step change in the system state. A challenge with thresholds is that they are often hidden and are crossed long before it is realized. The threshold is not where the boat goes over the edge of a weater fall, it is far up the river, when the people in the boat lose the option to get to the shore. ResilienceDefinition: Resilience is the capacity of a system, be it an individual, a forest, a city or an economy, to deal with change and continue to develop. The definition is that of the Stockholm Resilience Centre. With this definition, resilience is about how human and non-human systems can use shocks and disturbances like a financial crisis, climate change, or a hurricane to spur renewal and innovative thinking. There are many other definitions. For instance, the Oxford English Dictionary (1973) states “Resilience is the act of rebounding or springing back.” “Resilience is the capacity of a system to absorb disturbance and still retain its basic function and structure” (Walker and Salt, 2006). “Resilient systems bend under stress but do not break, so they are able to weather storms more effectively and recover more quickly. Adaptive systems are characterized by redundancy, diversity, efficiency, strength, interdependence, adaptability, and collaborativeness (Godschalk 2003). They are designed so that the failure of one part does not cause the whole system to collapse” (Walbert et al., 2012). “I want to reserve resilience to refer to the broader capability – how well can a system handle disruptions and variations that fall outside of the base mechanisms/model for being adaptive as defined in that system” (Hollnagel, 2006). “However, we would argue that we should extend the definition a little more broadly, in order to encompass also the ability to avert the disaster or major upset, using these same characteristics. Resilience then describes also the characteristic of managing the organisation’s activities to anticipate and circumvent threats to its existence and primary goals. This is shown in particular in an ability to manage severe pressures and conflicts between safety and the primary production or performance goals of the organisation” (Hale and Heijer, 2006). Disasters and SustainabilityDisasters affecting human communities constitute often severe disruptions and can reduce the sustainability of the community or render the community totally unsustainable. Therefore, our efforts to make progress towards sustainable development have to address disaster risk. There are two main programs at global level that focus on DRG. One of them is the Sendai Framework for Disaster Risk Reduction 2015-2030 (UNISDR, 2015). This framework was adopted at the Third UN World Conference on Disaster Risk Reduction in Sendai, Japan, on March 18, 2015. It aims to achieve a substantial reduction of disaster risk and losses in lives, livelihoods and health and in the economic, physical, social, cultural and environmental assets of persons, businesses, communities and countries over the next 15 years. It outlines seven clear targets and four priorities for action to prevent new and reduce existing disaster risks: (i) Understanding disaster risk; (ii) Strengthening disaster risk governance to manage disaster risk; (iii) Investing in disaster reduction for resilience and; (iv) Enhancing disaster preparedness for effective response, and to “Build Back Better” in recovery, rehabilitation and reconstruction. The other program at global level is the United Nations 2030 Agenda for Sustainable Development (United Nations, 2015) with the seventeen Sustainable Development Goals (SDGs). An important impediment to sustainability are disasters disrupting communities. The SDG 11 focusses on “Sustainable Cities and Communities” and aims to “Make cities and human settlements inclusive, safe, resilient and sustainable.” Each SDG comes with a number of targets, and several of the SDG 11 Targets directly relate to disaster risk:
Class Reading ListBack to ContentsLab 1: Risk ConceptsRisk GovernanceIn this lab, we will review terms relevant for disaster risk assessments and consider the approach based on the frequency of extreme events. ProbabilityRisk can be expressed as the product of hazard probability, vulnerability and value of exposed assets. The “Probability Density Function” (PDF) of a hazard (e.g., an earthquake or a volcano eruption) provides an information on the likelyhood of an event of a particular magnitude to occur in a given time interval. Knowing the PDF of hazards is crucial for thorough risk assessments. For discrete events, the Poisson distribution is a means to estimate the probability that a certain hazard (e.g., a 100-year flood) will occur one or more times in a given time interval (e.g., a century). Question Set 1: Basic ConceptsAnswer three of the four questions.
Lab Reading ListWikipedia, n.d., Probability density function. https://en.wikipedia.org/wiki/Probability_density_function. Wikipedia, n.d.,Probability distribution. https://en.wikipedia.org/wiki/Probability_distribution. van Niekerk, D., 2011. Introduction to Disaster Risk Reduction. USAID, pdf. Warfield, C., n.d., The Disaster Management Cycle. html. Back to ContentsClass 2: Observing Hazards and DisastersCONTENTSPreambleWhat is the relevance of natural hazards and disasters for those who are at the beginning of their studies at a university? What, besides meeting the requirements to have science class, is the motivation to take this class? The thoughts of Robert C. Koehler are of interest here. He writes “The science gets ever more dire. The politics runs the other way.”. A brief but very clear statement about the conflict between scientific evidence telling a story of increasing threats for our global civilization, and a societal dialog dominated by interests that are in conflict with this evidence. The example of natural hazards and the disasters these hazards can trigger is well suited to underline the importance of scientific evidence for the societal dialog and the long-term sustainability of a society in dignity. He points out that “We've claimed hold of the planet, but cluelessly, like the sorcerer's apprentice. Welcomed to the Anthropocene: the age of humanity intertwined with nature.” We have not just taken hold of the planet, we have evolved into the operators of the planetary life-support system. Unfortunately, our understanding of the physiology of planetary system is still very limited and our being intertwined with this system has led more to degradation of the non-human environment than anything else. Understanding the way we handle the risks associate with natural hazards, including those that have been modified by us or created by us, is of fundamental value for every citizen who wants to participate in the societal deliberations about how to settle, operate, and live on Earth. Koehler quotes astrophysicist Adam Frank, who said “Climate change is not a problem we have to make go away, in a sense that you don't make adolescence go away. It is a dangerous transition that you have to navigate ... The question is, are we smart enough to deal with the effects of our own power?” Modern climate change is a natural hazard of global scale that could easily trigger global catastrophes or even extinction class events. It is important to accept it as an aspect of us wielding our newly gained power to change the planet. But is is a dangerous transition and without urgently preparing for what might come, our civilization might be in deep peril. Looking at all natural hazards and the associated risks provides the skills to contribute to the discussion of how our modern society could prepare for the transition. Koehler makes an important point in saying that “the planet itself is transitioning, to God knows what. There may be no human race on the other side of that transition, but maybe there will be. Either way, we have to reach well beyond ourselves.” The Anthropocene is not a new geological (stable) epoch, it is an anthropogenic transition of the planet to a new homeostasis, and this new stable state of the Earth's life-support system may turn out ot be very different from the state during the Holocene. It may, in fact be far of from the conditions humans need to thrive and maintain a modern society. Whatever it turns out to be, understanding natural hazards can inform decision, policies, and societal actions to persist through the transition and come out on the other side in dignity. Those who are in their twenties or thirties today are faced with a very high probability that their future will be very different from the past of those who are much older, and that is not just because of the rapid technological development changing our lives almost every day. They will live on a planet that is very different from the one humanity has benefited of during the last 12,000 years. Understanding hazards, vulnerability, disasters and risk governance is a very good preparation for the transition into this unknown future. Observation NeedsThe understanding of hazards originating in the planetary system and the disasters caused by these hazards hinges on observations and data. Examples of of observing systems illustrate the important of these system for society and research. Observing HazardsDisaster risk governance can be considered as having four phases from preparedness, early warning, response to recovery. Each of these phases need to be informed by data releated to hazards and vulnerabilities. Over the last few decades, huge investments have been made to build and operate the observing systems that provide relevant data for all four phases. Earth observations are crucial for all four phases. Here, Earth observation is understood in a comprehensive way and comprises all observations of the human and non-human environment independent of how an observation was made and collected. Thus, it includes, among others, observations made with satellite-based sessors, air or ship-borne sensors, and fixed or moving sensors on the Earth surface. These sensors can make measurements of ambient conditions or use remote sensing methods to measure characteristics of objects in a distance ranging from nearby to very far away. The sensors can be in the hands of human beings, or human beings can be the sensors themselves. In most cases, the sensors measure a variable characterizing the state of the human or non-human environment, or can be used to derive such variables. Of particular importance are coordinate systems realized through reference frames that allow highly accurate measurements. Observing Small ChangesVery often, small changes are indicative of developing hazards and measuring these changes with high accuracy is a prerequisite for understanding hazards, detecting precoursors, assessing impacts, and informing the recovery after an event. For many variables of the earth system, the last few decades have seen a rapid improvement in the accuracy of observation techniques that allow us today to detect very small changes and utilize them in risk assessment and for early warning purposes. Class Reading ListBack to ContentsLab 2: Measuring small changes, getting data, assessing risks and disastersMeasuring Small ChangesIn this lab, we will consider the importance of stable reference frames for measuring small changes. Geodesy is the science that provides the theory and techniques to realize stable reference frames from local to global scales. A stable reference frames is crucial for measuring small changes. Maintaining a stable reference frame on a dynamic planet is very challenging and requires collaboration and interdisciplinary approaches. Geodesy is the science that provides the theory and techniques to realize stable reference frames from local to global scales. Getting dataAlthough the Internet and World Wide Web provide many means to search for data relevant for hazards, vulnerabilities, disasters, and risks, assessing data quality is often a big challange. Traditional earth observations based on in situ instruments and remote sensing from the Earth surface or airborne and spaceborne platforms provide useful data for many natural hazards. Data for the assessment of vulnerabilities often requires the combination of Earth observations, engineering data, and socio-economic data. Crowdsourcing, citizen science program, and big data analyses increasingly are used to collect the necessary data. Information on different types of damage, lives lost or people injured, and people displaced is far more difficult to collect and new apporaches to data collection need to be developed. Assessing major risks and disasterRisk assessment often are impacted by limited knowledge of the hazard PDF and the vulnerabilities of the built environment and the social fabric. Major risks are often associated with low-probability high-impact events. For them, the uncertainty in probability often results in underestimation of the risk. The quantitative assessment of major disasters is impacted by data gaps and poor data quality and good indicators for the size of a disaster are missing. Question Set 2: Observing Systems and Data AccessAnswer three of the four questions.
Lab Reading ListScan through this chapter: Plag, H.-P., Altamimi, Z., Bettadpur, S., Beutler, G., Beyerle, G., Cazenave, A., Crossley, D., Donnellan, A., Forsberg, R., Gross, R., Hinderer, J., Komjathy, A., Mannucci, A. J., Ma, C., Noll, C., Nothnagel, A., Pavlis, E. C., Pearlman, M., Poli, P., Schreiber, U., Senior, K., Woodworth, P., & Zuffada, C., 2009. The goals, achievements, and tools of modern geodesy, in Global Geodetic Observing System: Meeting the Requirements of a Global Society on a Changing Planet in 2020, edited by H.-P. Plag & M. Pearlman, 15-88, Springer Berlin. This chapter is included in this pdf Back to ContentsClass 3: Global Threats and Extraterrestrial HazardsCONTENTS
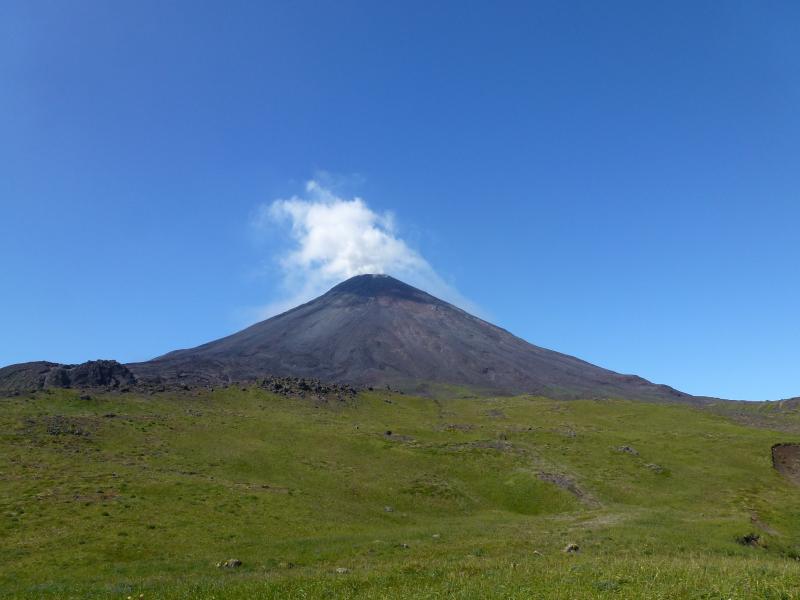
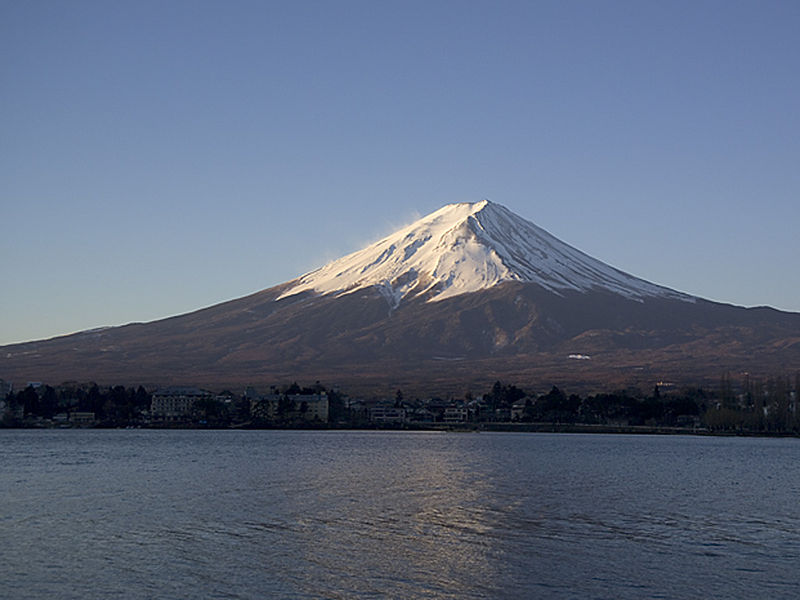
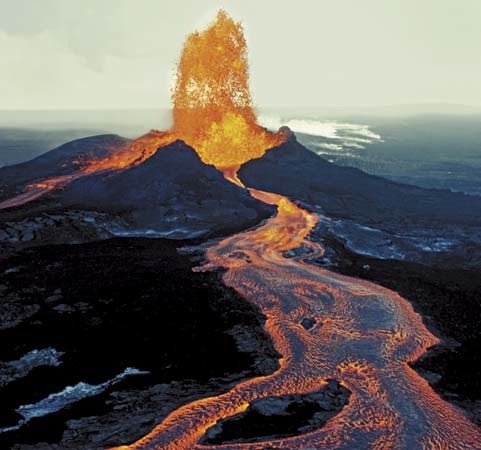
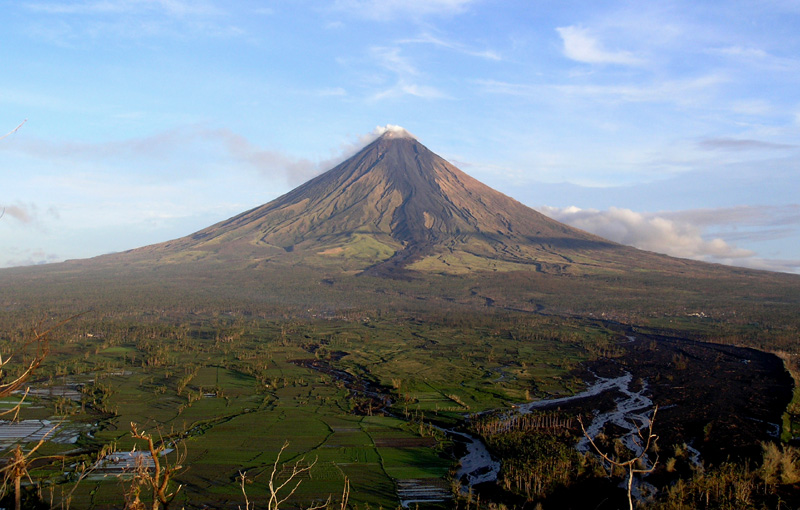
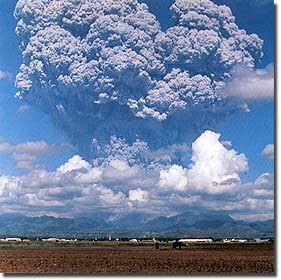
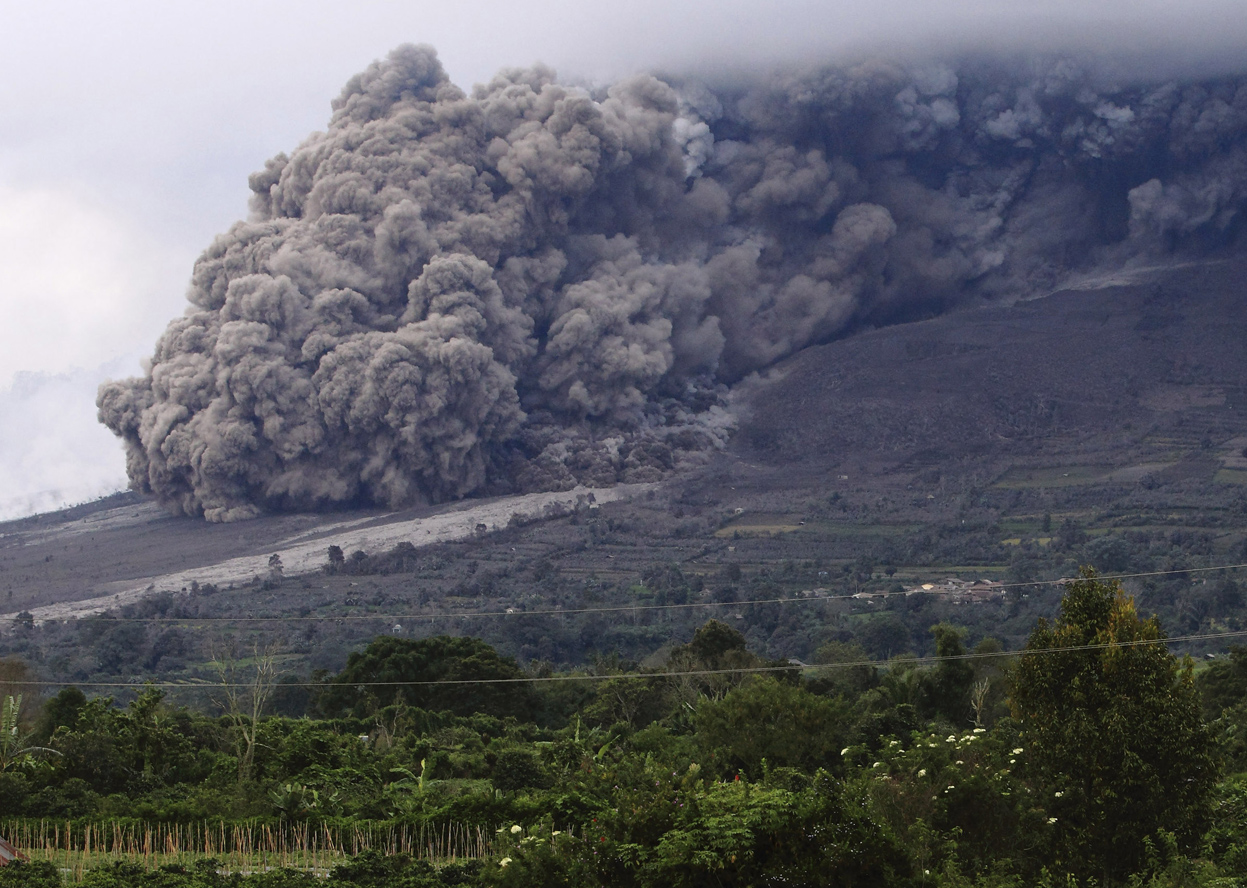
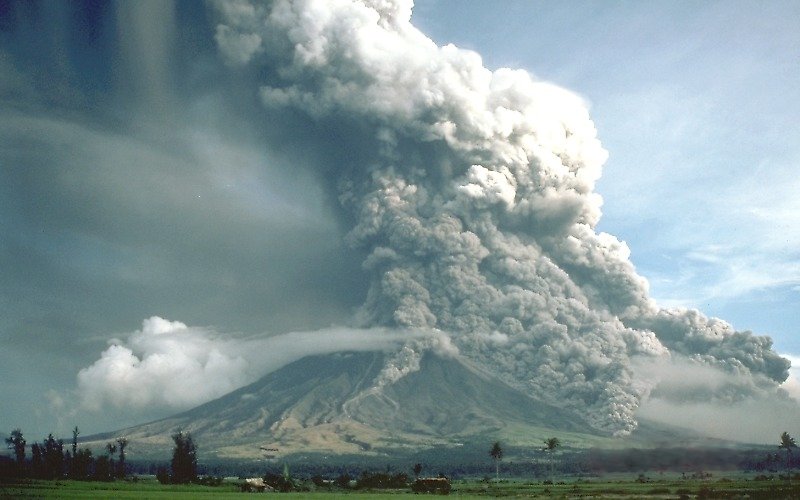
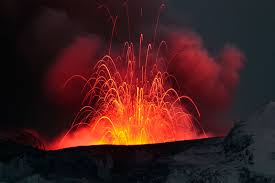
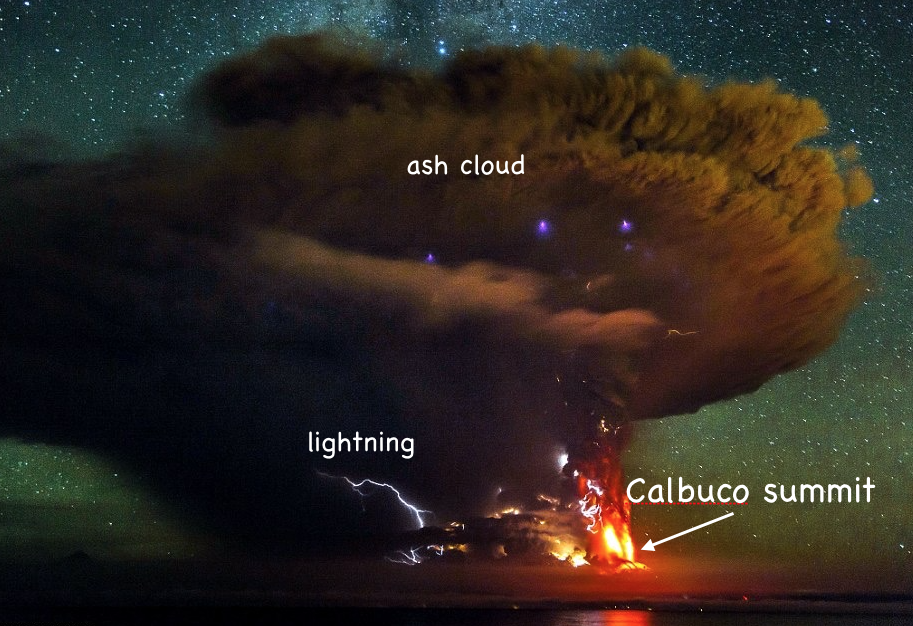
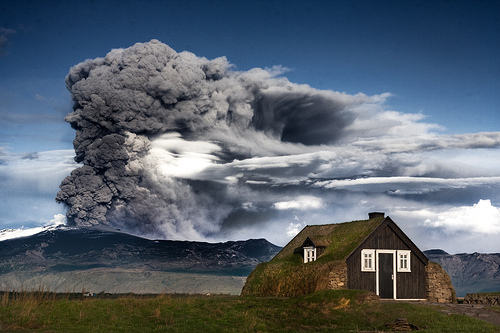
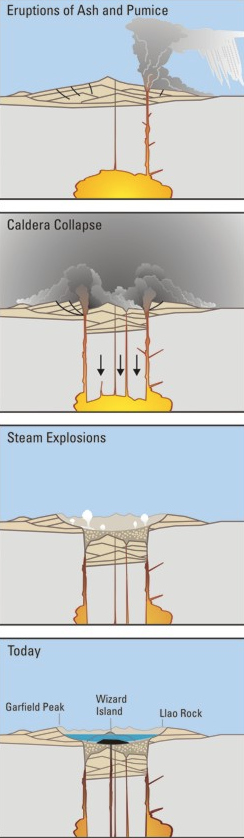
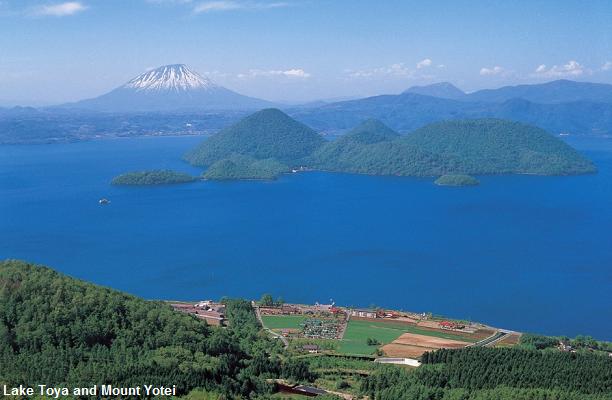
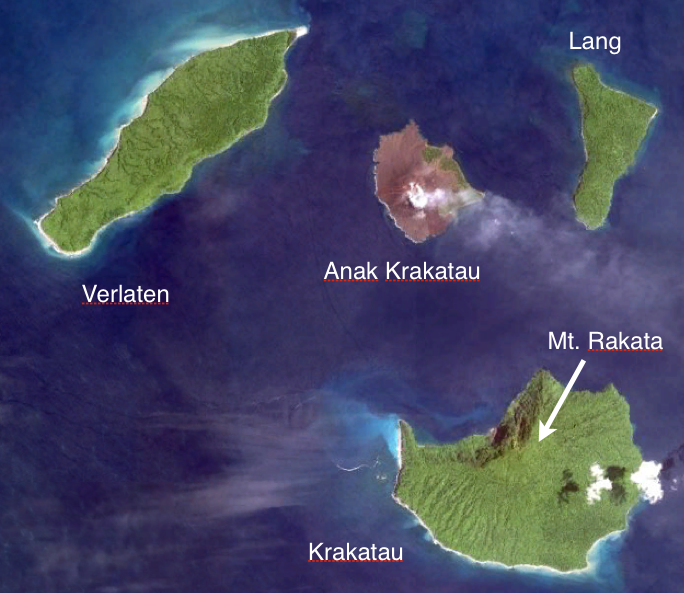
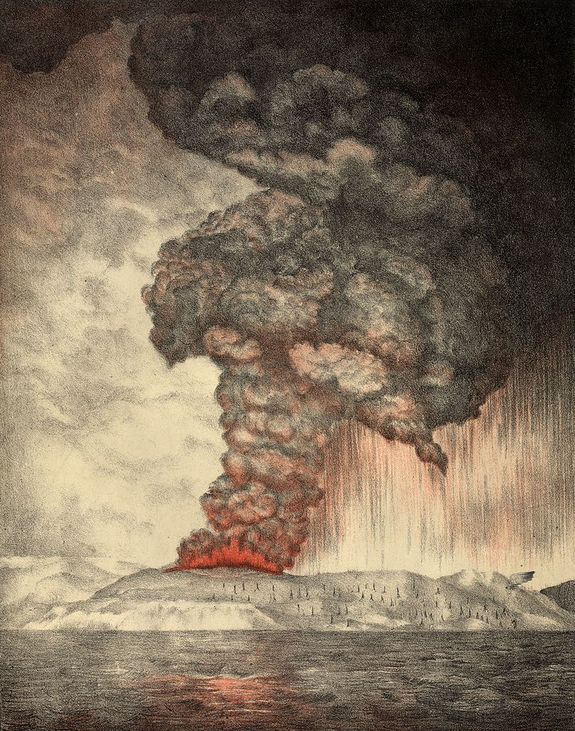
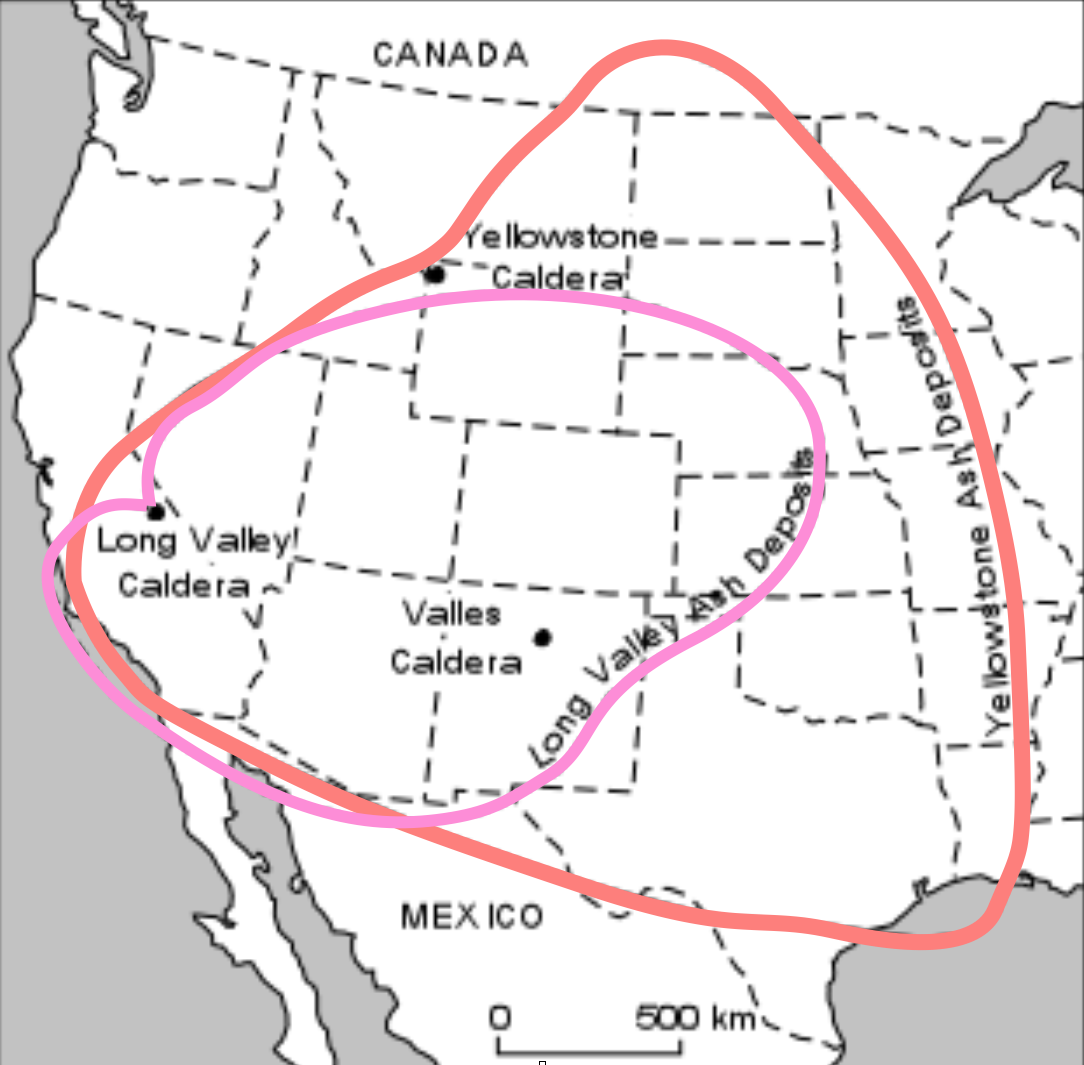
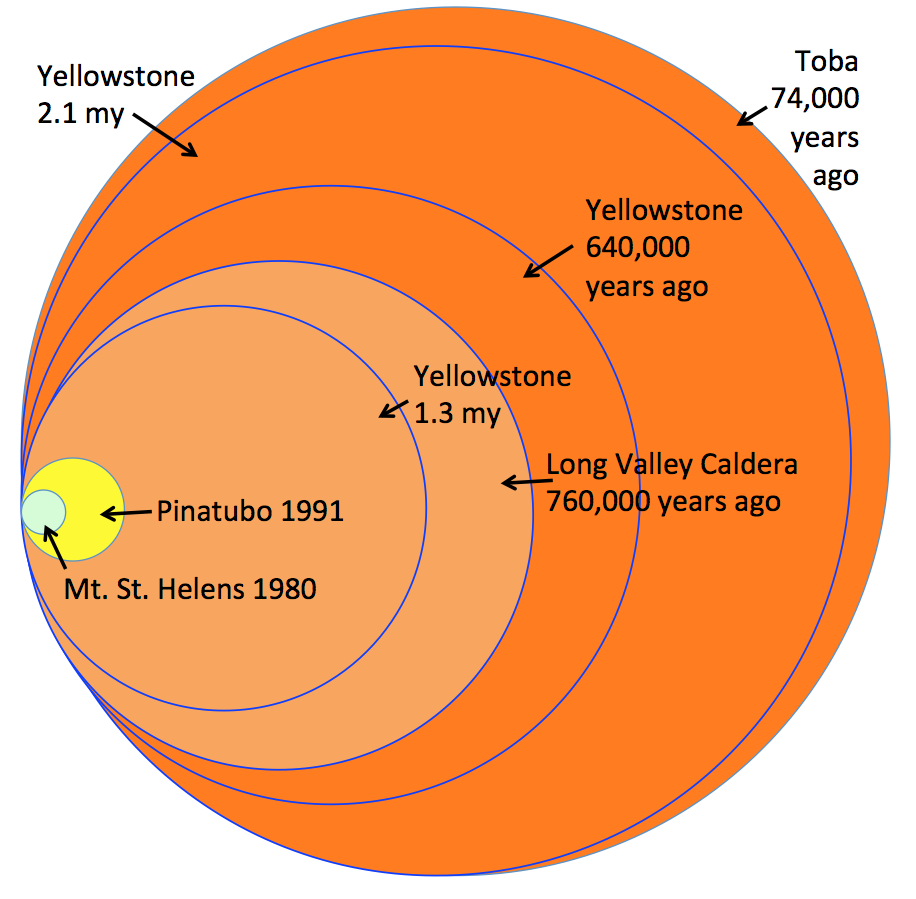
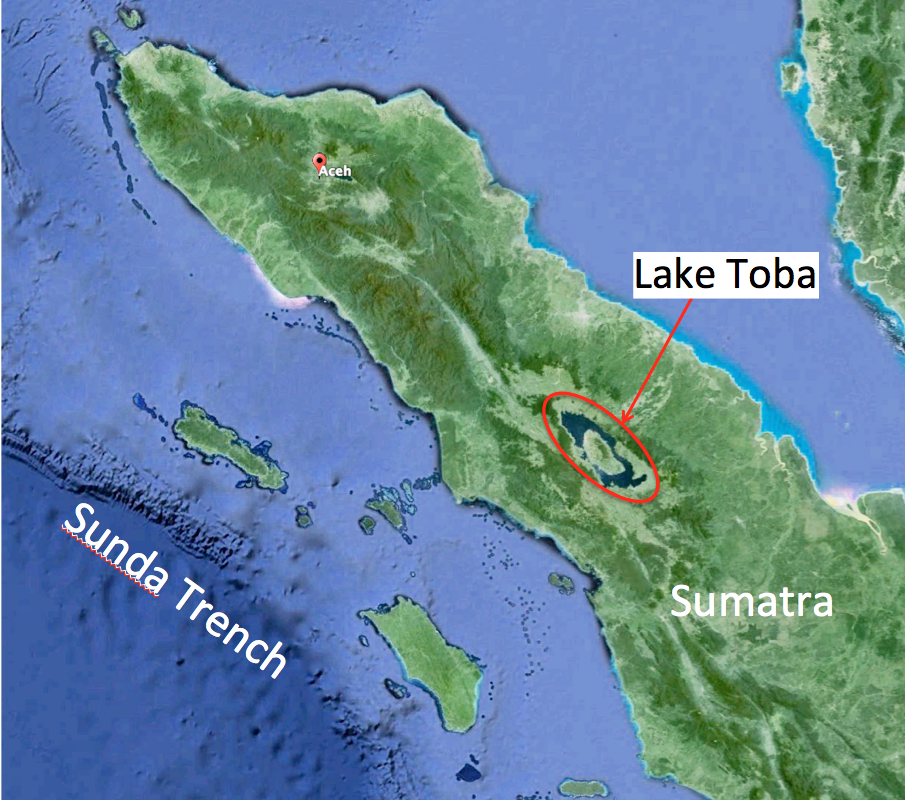
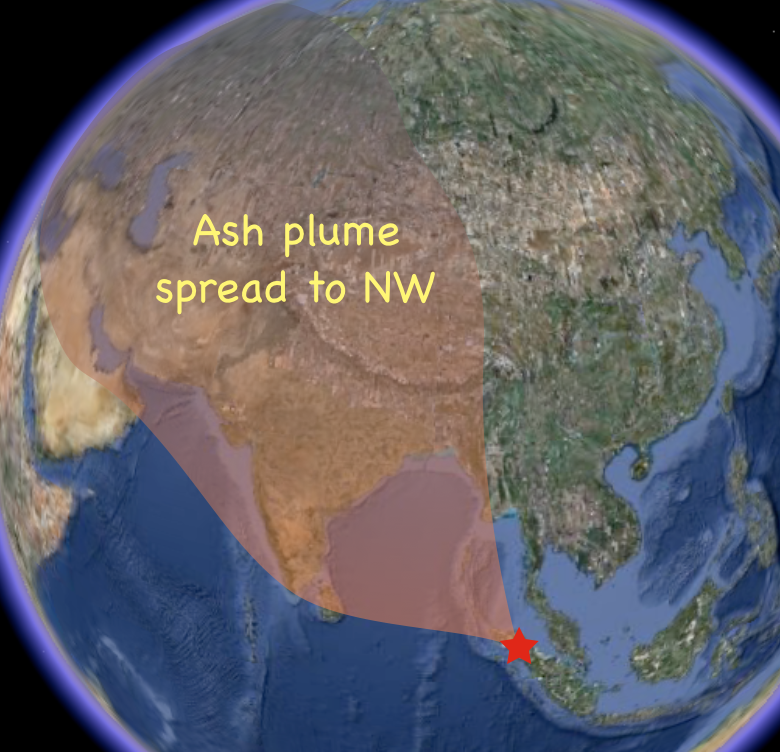
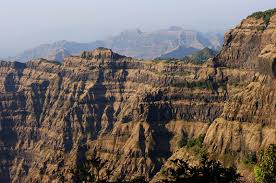
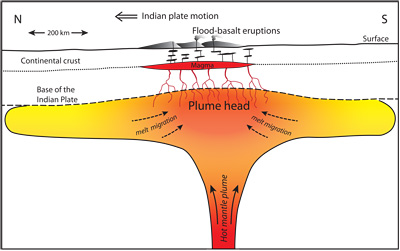
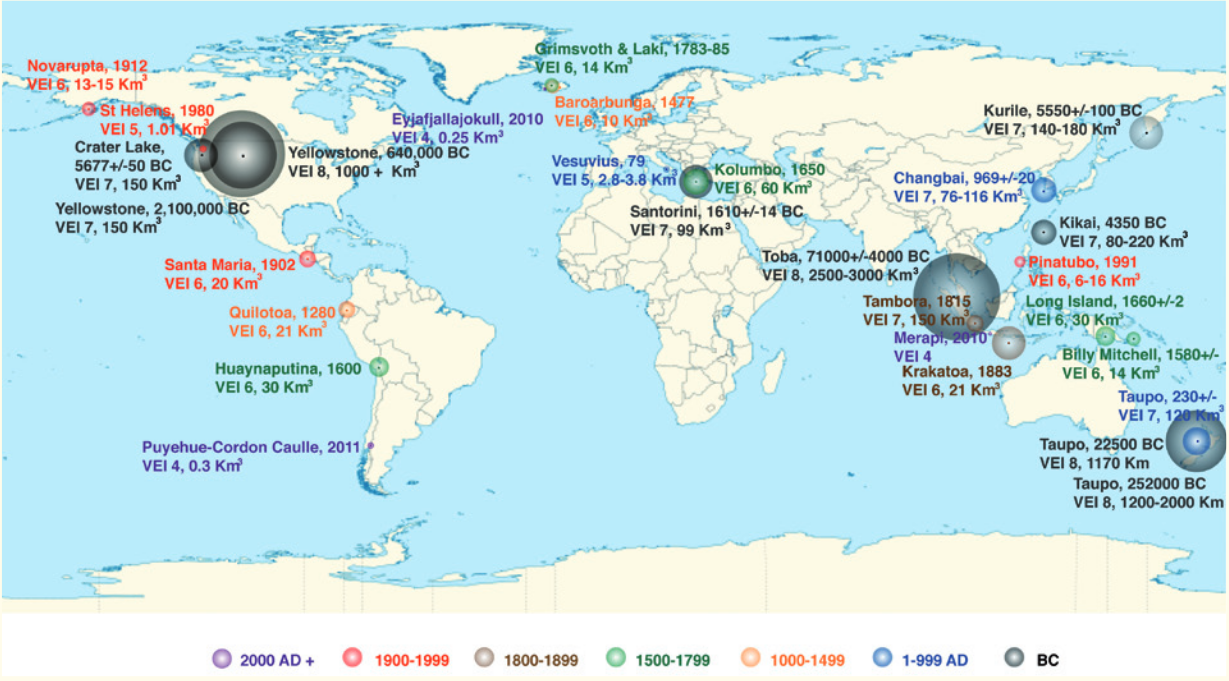
Extreme Natural HazardsExtreme natural hazards are often low-probability, high-impact events. Rare extreme events pose particular challenges for risk assessment and risk governance: they often are outside of past experience, and their likelihood is not well known or not known at all. Often these events come as so-called Black Swans (Taleb, 2012). Likewise, threats resulting from slow trends and slowly developing new circumstances are difficult to assess, and they can present extreme hazards. Moreover, while human individuals and communities posses the ability to react to severe individual events, slow trends with potential future threats are often ignored. Risk perception for slowly developing threats is often overly optimistic. Global Risk AssessmentsA number of groups and institutions are engaged in the assessment of global threats with the goal to inform leaders so that they can make better decisions. Examples are the assessment of Cotton-Barratt et al., 2016 and the annual assessment reports produced by the World Economic Forum (e.g., World Economic Forum, 2017, 2018). The reports produced by the World Economic Forum illustrate that risk and threat assessments keep changing over time a lot indicating both the uncertainty in the assessment as well as the development of new threats. A particular case are the Doomsday Clock Statements published in the Bulletin of the Atomic Scientists since 1947 (e.g., Mecklin, 2017, 2018). In summary, these statements measure the global threat level by minutes humanity is away from midnight of doomsday. In recent years, the assessment has slowly moved the clock closer to midnight. Risks Associated with Modern Global ChangeModern global change (MGC) refers to the changes in the Earth system humanity has caused or triggered. They include changes in the physiology of the Earth's life-support system by accelerating existing flows, interrupting flows, and creating new flows. Examples of accelerated flows are nutrients such as nitrogen and phosphorous, carbon, energy, and water. Examples of interrupted flows are movements of animals due to fragmentation of habitats, and flows in aquatic systems due to river dams, levies, and canals. Examples of new flows are new constituents that enter the air, soil and water systems as pollutants and plastics that are increasingly polluting the ocean and land. MGC also includes rapid changes in land use. Deforestation is rapidly progressing and fragmentation has a severe impact on ecosystem stability. For example, 70% of the remain forests are less than 1 km away from a forest boundary. These changes in flows are pushing the ELSS out of the global boundaries for the Holocene, which was an exceptionally stable geological epoch, which provide a "safe operating space for humanity" (SOSH). They have accelerated extinction rates and are causing rapid changes in climate. They also have the potential to trigger other natural hazards. The energy usage of humanity is comparable to the energy associated with major volcanic eruptions or major impactors colliding with the Earths. The use of this large amount of energy to reengineer the planetary system is creating many novel threats and risk assessment for these threats is extremely challenging. Major Global RisksDespite a very low probability, extreme extraterrestrial hazards pose a large risk to humanity. Therefore, several space agencies collaborate in a near-earth object service to ensure that any large objects potentially colliding with Earth is discovered early enough to take action and divert the object from its trajectory. Among extreme geohazards, large volcanic eruptions are associated with a very high risk. In the Holocene, at least seven large eruptions took place with severe impacts on humanity. It can be expected that a similar eruption today would cause a global disaster or catastrophe because of the interconnected and interdependent global civilization and an already stressed food security. Despite the high risk, no comprehensive monitoring of all volcanoes capable of large eruptions is in place. Pandemics poses severe threat, and on many country and intergovernmental levels, monitoring and response programs are in place to counteract any emerging epidemic with a potential to develop into a pandemic. The interactions of MGC with natural hazards will likely change the PDF of natural hazards, including those of droughts, heatwaves, wildfires, and storms. But even for volcanic eruptions, there are potential mechanisms that could lead to increased activity. In particular, mass movements on the earth surface (water, ice) can impact the stress field in the earth crust and asthenosphere and this can increase volcanic activity. Global Risk GovernanceA number of international and intergovernmental frameworks and conventions are aiming at risk management and risk reduction. However, an efficient governance for global risks has not been established. Plag et al. (2015) made recommendations for steps towards a global governance. Although their recommendations focus on governance for extreme geohazards, they apply entirely also for other extreme natural hazards. There are several core elements that are needed to address the global risk from extreme geohazards:
Extraterrestrial HazardsEarth is exposed to several hazards that originate in space. These include asteroids, meteorides, and comets that might lead to severe bollides or impacts, as well as radiation in form of space weather and solar storms, that can affect modern infrastructure. Gamma rays and proton storms also can pose hazards to life on Earth. There are many remanents of past impacts in form of meteor craters, and several mass extinction events are linked to extraterrestrial hazards. Today, several space agencies are engaged in monitoring Near-Earth Objects and space weather to provide timely warnings of emrging hazards. Extraterrestrial hazards can be grouped into:
We will not discuss the threats associated with extraterrestrial intelligence and human debris in space. NEO Search ProgramNear Earth Objects (NEOs) are meteoroids, asteroids or comets that pass close to the Earth. Potentially hazardous NEOs are estimated to be greater than 20 m in diameter. NEOs greater than 1 km in diameter have the potential to severely disrupt and destroy life. The United States of America leads discovery and tracking survey programs using optical telescopes; see https://cneos.jpl.nasa.gov/about/search_program.html for details. NASA and the European Space Agency determine the likelihood of an impact with the Earth. There are a number of NASA supported Near-Earth Object (NEO) discovery teams currently in operation. The early efforts to discover NEOs relied upon the comparison of photographic films of the same region of the sky taken several minutes apart. The vast majority of the objects recorded upon these films were stars and galaxies and their images were located in the same relative position on these films. Early discovery techniques included blink comparators and stereomicroscopes to examine the photographic images. Because a moving NEO would be in a slightly different position on each photograph and the background starts and galaxies were not, the NEOs appeared to jump back and forth when each image, in turn, was quickly viewed through a so-called blink comparator. Alternately, the NEO’s image appeared to “rise” above the background stars when two different and slightly offset images were viewed with a special stereo viewing microscope. All of the NEO discovery teams currently use so-called charged couple devices (CCDs) rather than photographic images. These CCD cameras are similar in design to those used in cell phones and they record images digitally in many electronic picture elements (pixels). The length and width of a CCD detector is usually given in terms of pixel elements. A fairly common astronomical CCD detector might have dimensions of about 2000 x 2000 pixels. While the CCD technology allows today’s detectors to be more sensitive and accurate that the older photographic images, the modern discovery technique itself is rather similar. Separated by several minutes, three or more CCD images are taken of the same region of the sky. These images are then compared to see if any NEOs have systematically moved to different positions from one image to the next. For a newly discovered NEO, the separation of the object’s location from one image to the next, the direction it appears to be traveling and its brightness are helpful in identifying how close the object was to the Earth, its size and general orbital characteristics. For example, an object that appears to be moving very rapidly from one image to the next is almost certainly very close to the Earth. Sophisticated computer-aided analyses of the CCD images have replaced the older, manual detection techniques but often times, a new NEO discovery is still verified using the human eye. Not surprisingly, discovery teams who search the largest amount of sky each month will have the most success in finding new NEOs. How much sky each telescope covers per month will depend upon a number of factors including the number of clear nights available for observing, the sensitivity and efficiency of the CCD detector and the field of view of the telescope. It is also important for search teams to extend their searches to greater and greater distances from the Earth or, in other words, go to fainter limiting magnitudes. A 6th magnitude star is roughly the limit of a naked eye object seen under ideal conditions by someone with very good eyesight. A 7th magnitude star would be 2.5 times fainter than a 6th magnitude star and an 8th magnitude star would be 6 times fainter than a 6th magnitude object (2.5 x 2.5 = 6.25). A difference of 5 magnitudes is a brightness difference of nearly 100 (2.5 x 2.5 x 2.5 x 2.5 x 2.5 is equal to about 100). In 1998, NASA established a goal to discover 90% of the NEOs larger than one kilometer in diameter and in 2005, Congress extended that goal to include 90% of the NEOs larger than 140 meters. There are thought to be about 1000 NEAs larger than one kilometer and roughly 15,000 larger than 140 meters. The progress toward meeting these goals can be monitored on the NEO Discovery page. Since NASA’s initiation of the NEO Observations program in 1998, Near-Earth Object (NEO) surveys have been extremely successful finding more than 90% of the Near-Earth Asteroids (NEAs) larger than one kilometer and a good fraction of the NEOs larger than 140 meters. The vast majority of NEO discoveries have been due to NASA-supported ground-based telescopic surveys including the Catalina Sky Survey (CSS) and Spacewatch near Tucson Arizona, the LINEAR project near Socorro New Mexico, Pans-STARRS1 on Haleakala, Maui, Hawaii, LONEOS near Flagstaff Arizona and the NEAT project run by NASA/JPL. Using a near-infrared space telescope in an Earth polar orbit, the NEOWISE project was actively discovering and characterizing NEOs for ten months in 2010 before its cryogens were exhausted. It continued another four months into early 2011 as a post-cryogenic mission. The LONEOS and NEAT surveys have been discontinued and Spacewatch is now primarily a follow-up facility. See https://cneos.jpl.nasa.gov/about/search_program.html for more information. Meteoroids and AsteroidsA meteoroid is a small rocky or metallic body traveling through outer space. Meteoroids are significantly smaller than asteroids, and range in size from small grains to 1 meter-wide objects. Objects smaller than this are classified as micrometeoroids or space dust. Most are fragments from comets or asteroids, whereas others are collision impact debris ejected from bodies such as the Moon or Mars. Asteroids are small, airless rocky worlds revolving around the sun that are too small to be called planets. They are also known as planetoids or minor planets. In total, the mass of all the asteroids is less than that of Earth's moon. But despite their size, asteroids can be dangerous. Many have hit Earth in the past, and more will crash into our planet in the future. That's one reason scientists study asteroids and are eager to learn more about their numbers, orbits and physical characteristics. If an asteroid is headed our way, we want to know that. Asteroids reside in the asteroid belt within the inner solar system whereas comets originate from the Kuiper belt in the outer solar system. Their relatively stable orbits can be perturbed gravitationally so that their paths can intersect the trajectory of the Earth, possibly resulting in a collision. A comet is a very small solar system body made mostly of ices mixed with smaller amounts of dust and rock. The main body of the comet is the nucleus, which can contain water, methane, nitrogen and other ices. Most comets are smaller than a few kilometres in diameter. When passing close to the Sun, a comet warms and its ices begin to release gas (outgasing). The mixture of ice crystals and dust blows away from the comet nucleus in the solar wind, creating a pair of tails. The dust tail is what normally can be seen from Earth. Meteorites are rock and/or metal fragments that land on Earth after falling from space at an average speed of about 64,000 km/h. While still in space, they are called meteoroids – or asteroids if they are very large. When a stray meteoroid is captured by Earth’s gravitational field the heat generated as it passes through Earth’s atmosphere causes its outer skin to vaporize, glow, and become visible as a meteor streak. Roughly 44,000 kg of meteoritic material falls onto Earth each day, almost all as fragments a millimeter or smaller in diameter. Larger pieces do fall, including a few in North America in recent times. Very large meteoroids and asteroids are extremely rare, but have caused catastrophic damage in the geological past. Stony meteorites are rock-like pieces of left-over debris from our solar system’s formation. Stony meteorites, which are similar to rocks on Earth, comprise nearly 85% of meteorites found. They range widely in composition and also in size, from microscopic to several meters across. There are two main groups of stony meteorites:
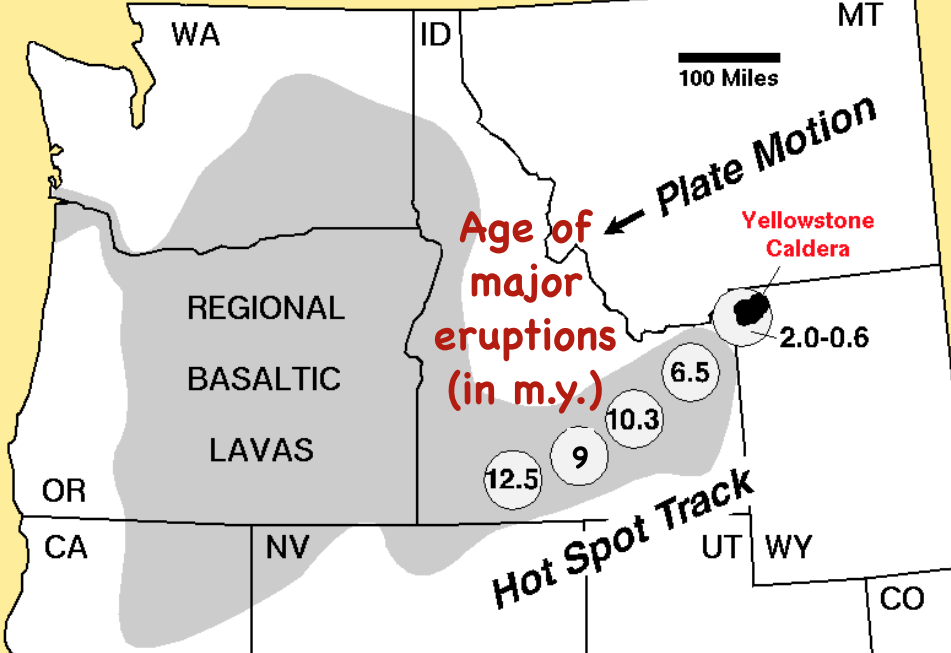
Iron meteorites are formed in the core of planetary bodies from a mixture of iron and nickel metal. Although most metallic meteorites are known as ‘iron meteorites’, they are really made of a mixture, known as an alloy, of solid iron and nickel. Such alloys do not occur naturally in Earth’s crust, but form inside its core, or the core of other large planetary bodies. Iron meteorites are magnetic due to their high iron content (90–95%) and they are very dense, which makes them easy to recognize. They may have an internal crystalline structure known as Widmanstätten pattern formed by slow exsolution of the solid alloy. Many iron meteorites have a smooth, shiny surface with shallow depressions called regmaglypts that form as the meteorite passes through Earth’s atmosphere. This surface feature distinguishes iron meteorites from the left-over material from old iron foundries known as ‘slag,’ which does not have regmaglypts. More than 8,000 asteroids and meteoroids orbit in the asteroid belt, between Jupiter and Mars. The asteroid belt, located in the orbital plane between Jupiter and Mars, contains at least 8,000 asteroids that are 10 to 20 km in diameter and millions of smaller ones. The orbits of asteroid belt objects are generally stable, although they are often much more elliptical than those of Earth or Mars. However, not all of the asteroids are in the same orbital plane, which can lead to asteroid-asteroid collisions that in turn may knock an asteroid into a less stable orbit. A few dozen of the objects in the asteroid belt are over 100 km across. Ceres is the largest at 960 km diameter, a little less than 1/4 the size of the Moon, and shows evidence of recent landslides and domes that have formed from sodium carbonate-rich ice oozing to its surface. Many of the asteroids are irregularly-shaped and pockmarked by craters that formed by collisions with smaller meteoroids and asteroids over their long history. Meteor showers occur frequently, but large meteorite falls are very rare. Between 4.1 and 3.8 billion years ago, the solar system’s planets and their moons underwent a barrage of asteroid impacts known as the Late Heavy Bombardment. The frequency and size of asteroid impacts gradually reduced to only a few really large events since about 2.0 billion years ago. Today, at least one meteorite of several cm to a meter in size, with velocities of 15 km/s or more, lands on Earth each year, but larger meteorite falls are rare. When Earth’s orbit passes through locally high concentrations of space dust, sometimes left behind by a passing comet, we see meteor showers such as the mid-August Perseid Shower, named for the position in the sky from which the meteors appear to originate. Meteor showers are usually harmless events, although in 2003 a meteoroid impact that occurred during a meteor shower destroyed two houses and injured several people in India. Energy release from a meteorite impact creates a circular crater with a characteristic morphology. When an asteroid or meteoroid impacts the surface of a planet, moon, or another asteroid, it releases energy as a shock wave. The kinetic energy Ek of the impact shock depends upon the mass m and velocity v of the impactor. The shock wave radiates outward and, instantaneously, fractures the surrounding rock into pieces, called breccia. The shock also melts rock at the impact site and blasts tiny globules of molten rock, along with pulverized rock fragments and meteoritic material, high into the atmosphere. The blasted-away material is called ejecta and it leaves behind a circular crater. Rock in the crater’s center rebounds almost instantaneously, creating a central uplift in the crater. The molten ejecta globules can be carried far in the atmosphere before they are strewn as glassy objects, called tektites, over a very wide region around impact sites. Earth’s erosional and tectonic forces have removed much of the evidence for asteroid impact craters. There are presently 190 confirmed impact craters on Earth, ranging from about 50 m to 300 km in diameter, but this is a tiny number compared to the thousands of craters, large and small, that are visible on the Moon. Reasons for the lack of impact craters on Earth include: (i) tectonic processes have reworked the margins of the earliest stable continental crust, called cratons, leaving relatively small remnants of craton surface rocks preserved; (ii) there is no oceanic crust older than about 270 million years; (iii) erosion by wind, water and/or ice has modified crater morphology; (iv) younger sediments and volcanic rocks have covered many smaller craters; and (v) the friction of passing through Earth’s atmosphere slows down and melts or completely evaporates small meteoroids, whereas on the Moon these would still form craters in impact, albeit small ones. There is evidence of large terrestrial impacts. The Vredefort structure in South Africa and the Sudbury Impact Crater in Canada, are the two largest known impact structures on Earth. The largest confirmed meteorite impact on Earth is the Vredefort Dome in South Africa, which was formed 2.02 billion years ago by a 10 km diameter impactor. The Vredefort crater is at least 120 km in diameter now, although some estimates put the crater’s original diameter at 300 km. Rocks from Earth’s lower crust are exposed in its center along with a large volume of impactgenerated melt rock called pseudotachylyte. The crater has a rim of upturned sedimentary rocks and contains numerous examples of shatter cones and shocked quartz grains. Earth’s second-largest impact crater formed near Sudbury, Canada. The originally circular, 1.85 billion year-old crater has been deformed into a roughly elliptical shape by younger tectonic events, but still contains shatter cones and other shock features, as well as high amounts of nickel, platinum, copper, and gold. The Chicxulub impact has been linked to the end-Cretaceous mass extinction. Several mass extinctions of biota on Earth may have been caused by asteroid impacts. The most famous is the demise of dinosaurs at the end of the Cretaceous Period, 65.5 million years ago. Impact of a large asteroid affected life on Earth 65.5 million years ago, at the end of the Cretaceous Period. The asteroid, estimated as 12–14 km in diameter, made a crater 170–180 km across on the edge of the Yucatán Peninsula. Known as the Chicxulub crater, the structure is best seen using remote sensing data. Surface rocks were pushed downward by as much as 30 km by the impact, and then rebounded to heights of 10 km above surface. The estimated energy released was equivalent to 5∙1023 J (about 100 times the energy released during the last eruption of the Yellowstone super volcano). Enormous tsunami waves would have been generated. Impact breccias, quartz grains with shock features, and tiny spherules made of melted rock, are common within the crater and around its rim. Vaporized ejecta reaching the stratosphere would have caused years of darkness. The timing of the Chicxulub impact coincides with the extinction of 85% of Earth’s animal and plant species, including almost all species of dinosaurs. All the major continents and oceans were affected. However, the concept of an impact origin for this mass extinction event was controversial for decades, until the Chicxulub crater was discovered and high IR concentrations were found in very thin layers of sediment of exactly the same age from locations around the world. CometsComets are balls of ice, dust, and rock that normally reside beyond the orbit of Neptune. When the solar nebula of gas and dust condensed to form the Sun and its planets, some of the leftover material formed balls of frozen water (H2O) and rock fragments that we call comets. Some comets reside in the Kuiper Belt, beyond the orbit of Neptune, but most are in the Oort Cloud, well beyond Pluto, and some are occasionally perturbed into eccentric orbits. Some comets have a rocky center and many also contain small amounts of CO2, CO, ammonia, and methane. They only become visible when, as they approach the Sun, their frozen surfaces emit gas that streams behind them as they travel. Comets that take less than 200 Earth-years to orbit the Sun have well-documented orbits, such as Halley’s Comet. Others take much longer to complete one orbit and are less well mapped, therefore their direction of approach and distance from Earth as they pass can be unpredictable. BolidesBolides are meteoroids and cometary fragments that explode on entering Earth’s atmosphere. Asteroids, meteoroids, and fragments of comets that explode in Earth’s atmosphere before reaching the surface are called bolides. The explosions are seen as very bright meteors, sometimes called ‘fireballs.’ In a 20-year period, more than 500 bolides with diameters > 1 m are typical. A bolide thought to be at least 60 m in diameter and weighing 108 kg exploded in Earth’s atmosphere on June 30, 1908, high above a remote forested region of the Tunguska River in Siberia. Roughly 80 million trees were flatted by the blast. Energy estimates are between 1.3 and 2.1•1016 J. A man more than 65 km away from the blast epicenter reported being thrown out of his chair by the shock wave. A bolide of that size over a large city would be truly catastrophic. A recent example of a bolide is the one that occurred over Chelyabinsk, Russia, in 2013. An unexpected bolide blast over southern Russia shattered windows and caused multiple injuries. On February 15, 2013, a bolide at least 17 m in diameter exploded at a height of about 20 km in the atmosphere above Chelyabinsk, Russia. The bolide had an estimated energy release equivalent to over 2•1015 J. The blast was recorded by seismic stations around the world. Although initial reports indicated a number of deaths, there were no direct fatalities from the bolide, but 1,500 people were injured, some seriously, by flying glass and debris. By coincidence, NASA had predicted that a different asteroid, they had named 2012DA14, would make a close approach to Earth on about the same day, however they were unaware of the Chelyabinsk asteroid; the two were on completely different and unconnected orbits. Space WeatherSolar flares and coronal mass ejections occur frequently and can disrupt telecommunications. Streams of electrically charged particles are constantly emitted by the Sun as a ‘solar wind.’ We see the effects on our upper atmosphere most often as an Aurora Borealis at high latitudes. Variations in the Sun’s magnetic field, especially in its photosphere and chromosphere produce intense, localized solar X-ray and proton flares, whose frequency and strength are often correlated with sunspot activity. A solar X-ray burst does not produce an Aurora Borealis, but it does disturb the ionosphere and can jam both high- and low-frequency radio signals. Many solar flares trigger coronal mass ejections (CMEs), which blast billions of tons of charged gas into space at speeds of hundreds to thousands of km/s. CME’s are classified according to their speed, with the fastest also being the most rare. A CME can take from one to four days to reach Earth, where it can cause serous disruption to telecommunications and power grids. Because of their potential to disrupt human society on Earth, solar flares and CME’s are monitored as part of NASA’s Space Weather program. The Carrington Superstorm illustrates the threats posed by solar storms. Records of major solar flares and their associated coronal mass ejections first began in 1859. Solar flares are classified today according to their strength in watts per square meter reaching Earth, using a lettered scale in which each level is 10 times greater than the next lower rating. For example, an M0 flare is ten times greater than a C9, and an M3 is ten times greater than an M2. The strongest, most damaging flares are given X values, with no upper limit. On September 1, 1859, an intense white-light solar flare was observed by British astronomer Richard Carrington. This was the first recorded observation of a solar flare, which lasted for about 5 minutes and is now classified as an X15 Super Geomagnetic Storm. When the intense burst of energy reached Earth it caused aurora-induced electrical currents in telegraph wires that were sufficient to give electric shocks to telegraph operators. In the hours before dawn next morning, bright auroras were visible as far south as Cuba. A large solar flare on August 4, 1972, disrupted telephone communication across the state of Illinois and caused AT&T to redesign its power system for transatlantic cable. On April 2, 2001, an X20 flare became the largest so far on record; it generated a 2,000 km/s CME blast that, fortunately, was not directed toward Earth. The Earth’s safety shield is the magnetic field. Earth’s magnetic field deflects the solar wind, shielding the planet from harmful ions. Earth is protected from much of the ionized solar wind and from most solar emissions by its magnetosheath, which is the result of the magnetic field generated by electrical currents in Earth’s core. The magnetosheath is not symmetrical, but is compressed on the daylight side of Earth (the side facing the solar wind) and extended on the dark, night-time side into a long tail, called the magnetotail. Large solar flares and very fast-moving CMEs further distort Earth’s magnetosheath and cause geomagnetic storms that can seriously disrupt satellites and telecommunications. A powerful geomagnetic storm occurred in May 1921, burning out telephone and telegraph wires across Europe and North America. On March 10, 1989, an X15 solar flare and CME caused a geomagnetic storm three days later that disrupted weather satellites and shut down the power grid of Quebec province, Canada, for over 9 hours. Class Reading ListGlobal ThreatsExtraterrestrial HazardsNational Research Council, 2010.Lincoln, D., 2017. Earth dodges a cosmic bullet — for now. CNN, see here. Back to ContentsLab 3: Disaster Risk Management and Global Risks; Case Study 1Probability Density Function of Natural HazardsThe PDF of a specific natural hazard can be established based on past records of occurrences of this hazard. For most hazards, the PDF will vary in space and can also change in time. For hazards that constitute discrete events, events that occur on average once in, for example, 10 years, 50 years, 100 years, etc. can be identified from the PDF. For continuous variables, the PDF is also a continuous function. An example is the change in global air temperature over a 100 year period. For the Holocene, up to 1900, the changes in global temperature within a hundred year period were small and narrowly distribute around a zero mean. Likewise, changes in atmospheric CO2 were small with a slight tendency to an increase. The PDF determined for the 120 centuries of the Holocene was stable and thus could be used for each century. However, for the 21st century, a large temperature increase is taking place and the PDF for the 21st temperature increase is centered around a non-zero value with a long tail towards high values. Disaster Risk GovernanceThe disaster risk management cycle includes four main phases: (1) awareness and preparedness; (2) early warning; (3) rescue; (4) recovery. Different authors present some variations in how these phases are described and named, but all presentations of the cycle have similar stages. For awareness and preparedness, knowledge of the hazards that can occur in an area and the PDF of these hazards is a crucial input. Outreach to the broad population and accessible integrated information determines the awareness and risk perception. For early warning, observing systems that can detect emerging hazardous events in a timely manner and means to broadcast warning are key elements. For rescue, means to assess the extent and areal distribution of damage are important and knowledge of possible subsequent hazards triggered by the initial event is required to reduce the risk for rescue teams. Efficient rescue is crucial for limiting the disaster, in particular the loss of lives. Communication is crucial in this phase. For recovery, in the first phase of the recovery, restoration of public services such as power, communication, health, and transportation helps to ensure rapid recovery. In subsequent phase, learning from the disaster and modify the design of the built environment are important steps. Global ThreatsGlobal threats include a number of natural and anthropogenic hazards. In the past, extreme natural hazards such as major volcanic eruptions, large impactors, droughts and famines, and pandemics were the main hazards that could cause disasters ranging from global disasters to extinction events. Modern global change caused by humanity in recent centuries has increased the probability of extreme anthropogenic hazards that could cause extreme disasters. Modern climate change has the potential to cause unparalleled human disasters and increase extinction up to the level of an extinction class event. A rapid sea level rise would most likely cause a global disaster or catastrophe. The emerging new climate unknown to humanity and most ecosystems could easily come with new extremes in storms, floods, heat waves, and droughts, and also generate unknown pandemics. The resulting human migration of global scale has the potential to cause social unrest and wars on global scales. Managing Global RisksAddressing global risks requires international and intergovernmental collaboration. While there are a number of frameworks and conventions aiming at risk management, an efficient governance for global risks has not been established. Plag et al. (2015) made recommendations for steps towards a global governance (see class 3). Case Study 1: Extraterrestrial HazardYour Extraterrestrial HazardMake a selection of a specific extraterrestrial hazard that you will describe and analyze according to the guidelines for the case study. Discuss your selection with the instructor to make sure you made a valid selection. Collect the data neededYou are asked to spend time searching the internet for data relevant for the case study. You can do this alone at home or in the library, or you can group in small groups and work together. Make sure that if you work in a group, that you prepare a paper that represents your individual work. This work may benefit from your discussions with your fellow students. Please, consult the guidelines for the case study. Work During Lab HourSince we have lost some time due to class cancellation, the lab time on September 24, 2018 will be available for you to work on your case study paper. Feel free to ask questions and get comments from the instructor before that lab hour by email. SubmissionA draft of the case study paper should be submitted not later than September 26, 2018. Note that the draft will not be graded, but it is an opportunity for you to get supportive comments. Comments on the draft will be returned not later than September 30, 2018. The final case study paper, which will be graded, is due October 3, 2018, 6:00 PM. Question Set 3: Disaster Risk Management and Global ThreatsAnswer three of the four questions.
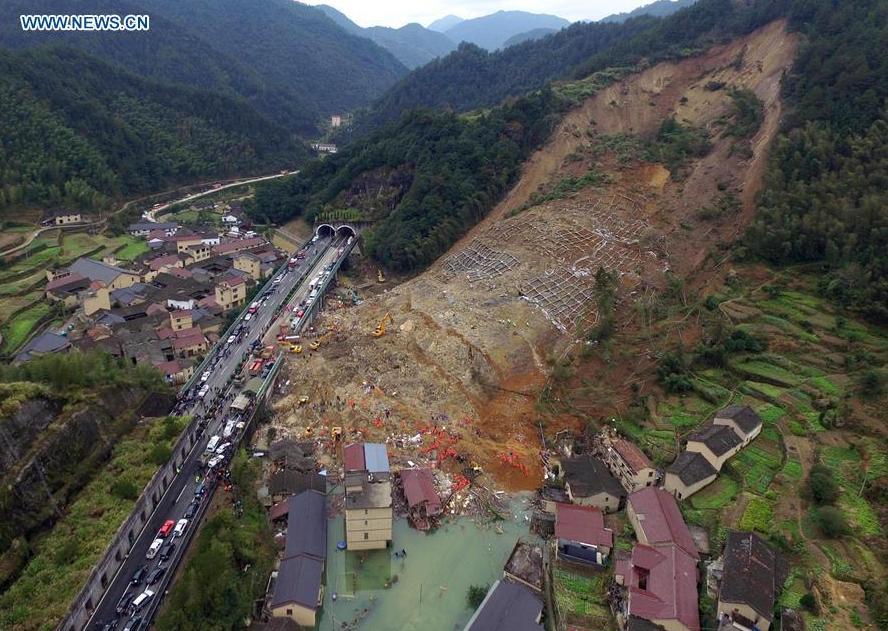
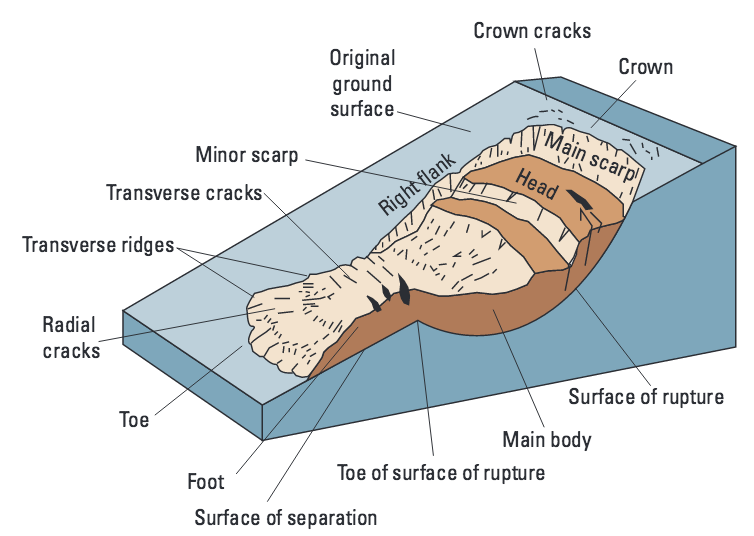
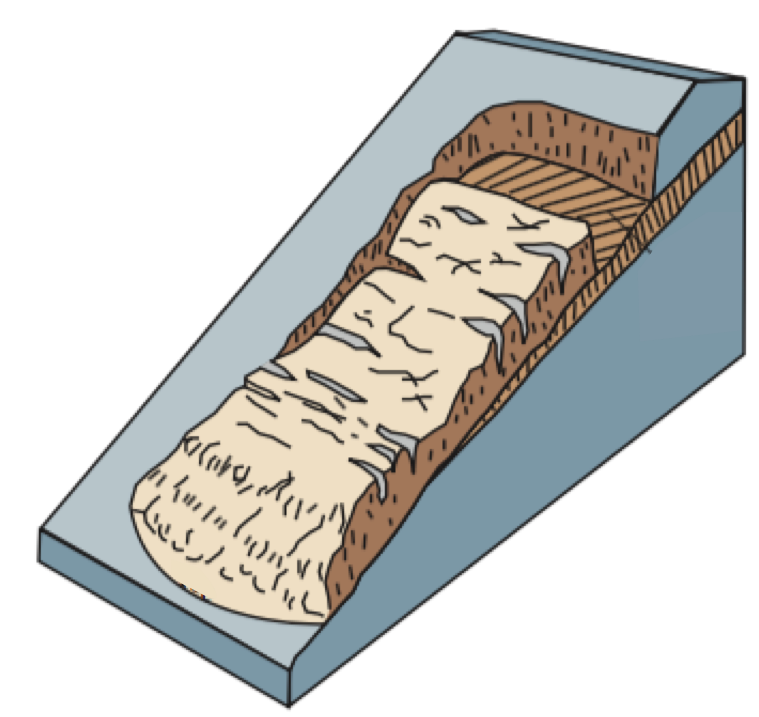
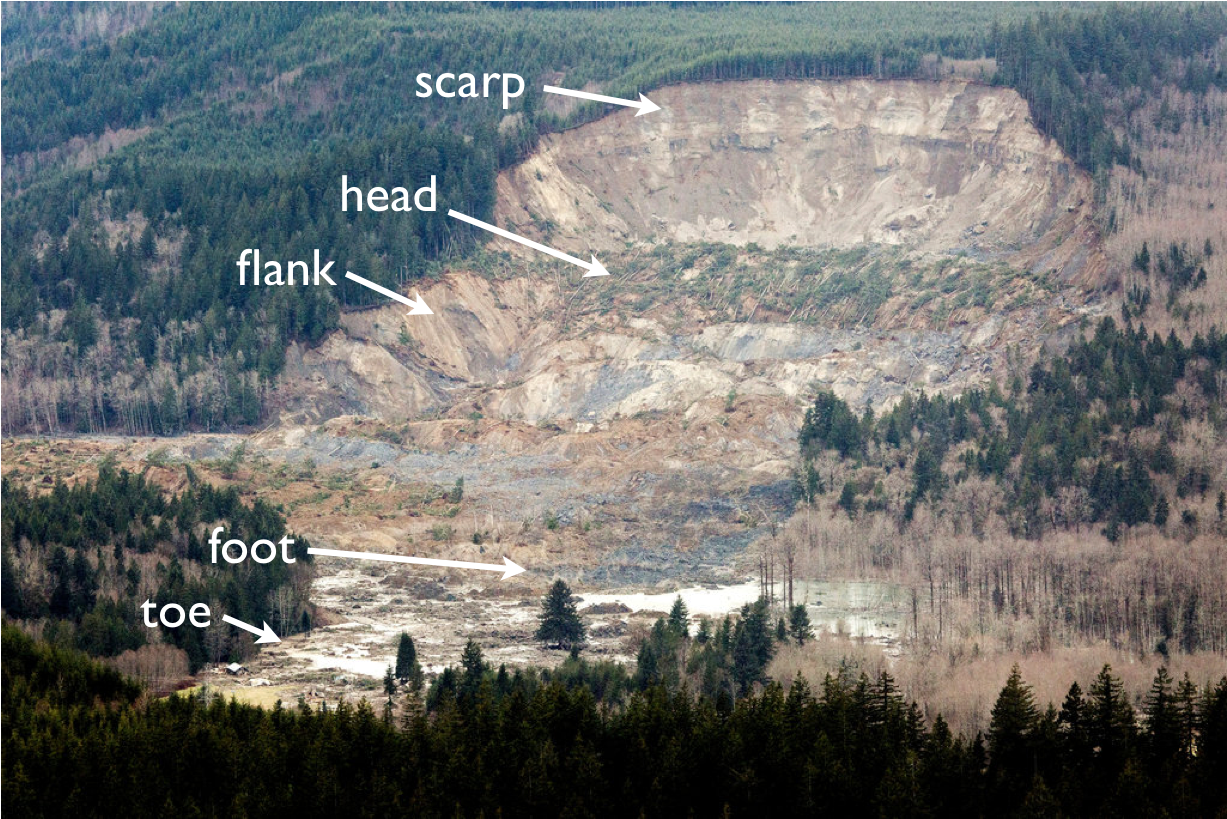
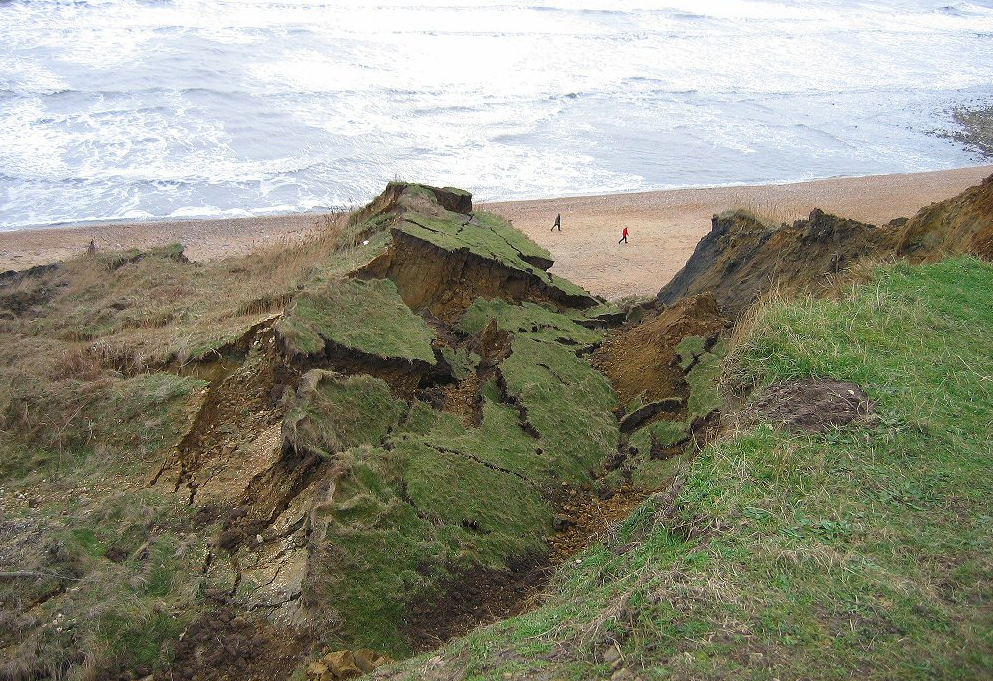
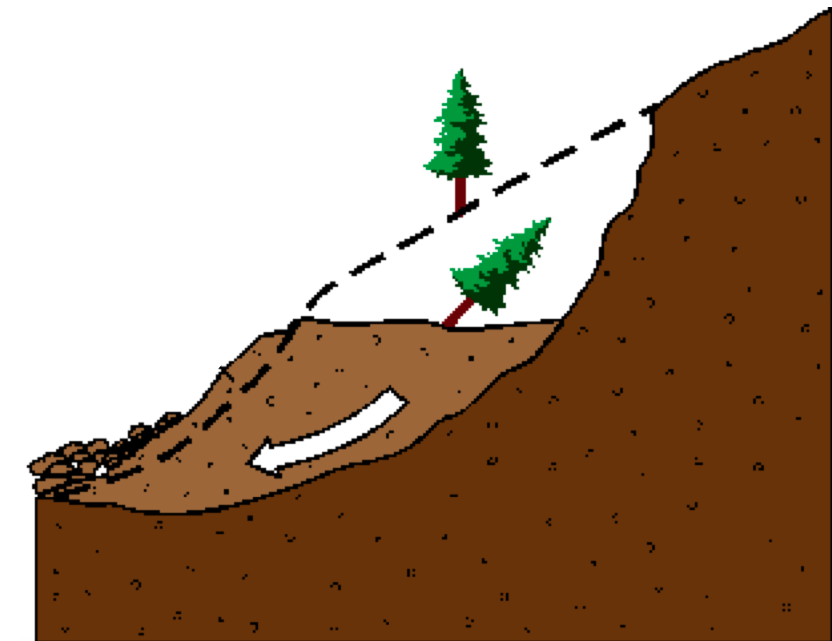
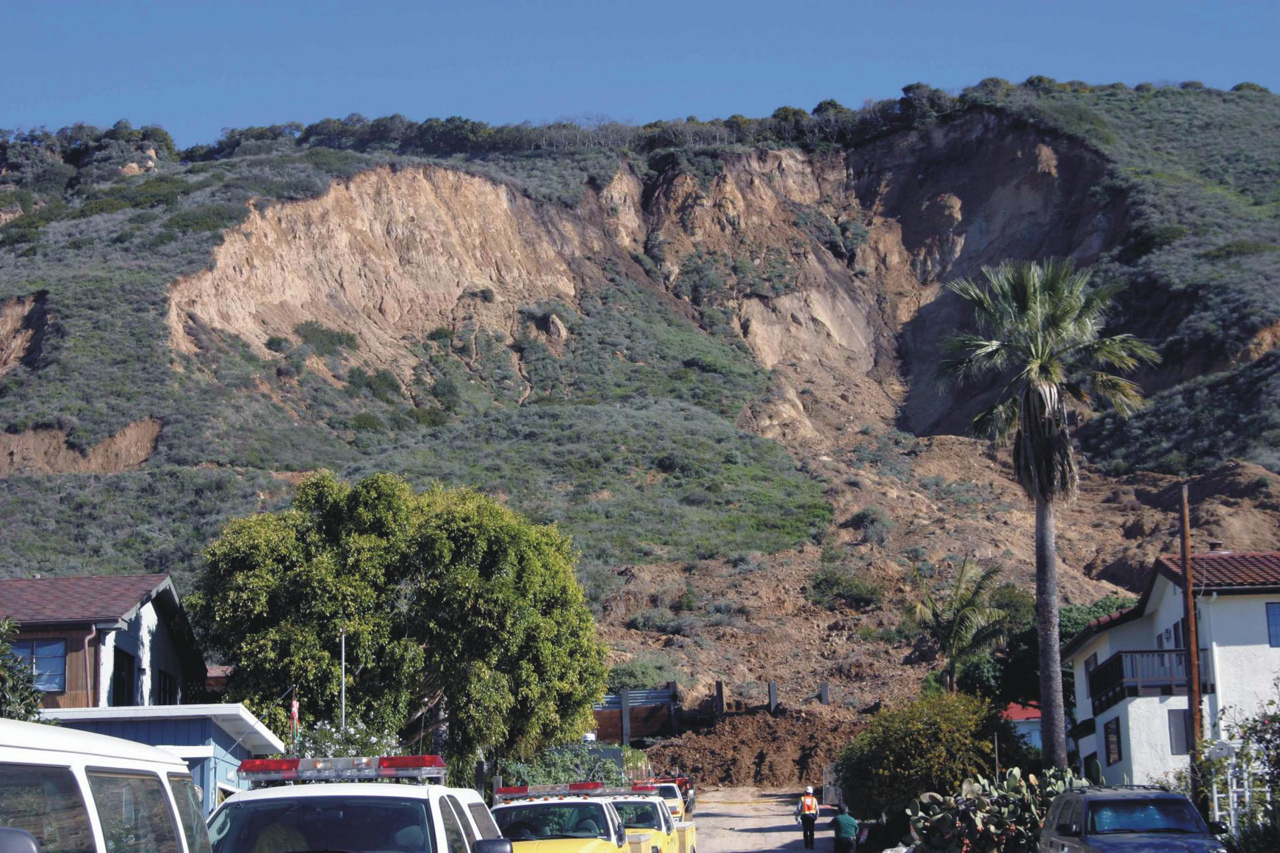
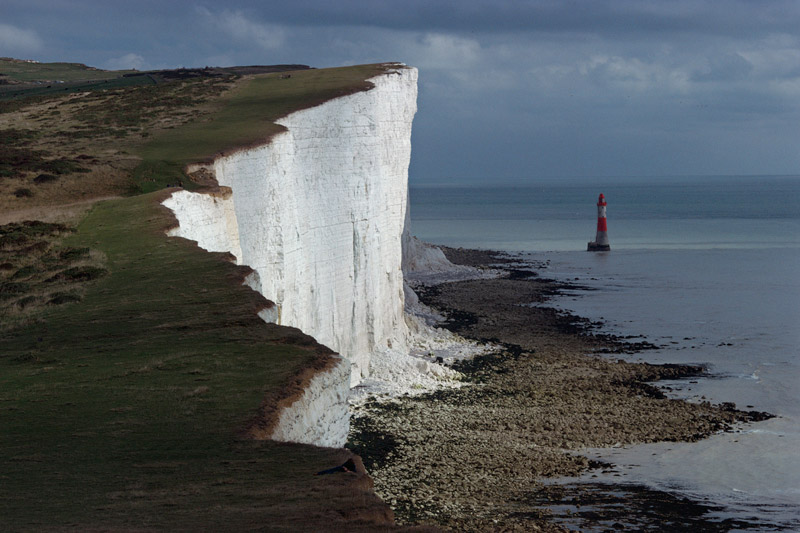
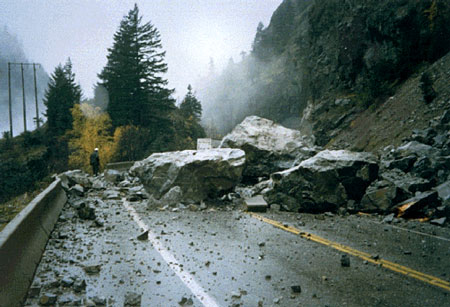
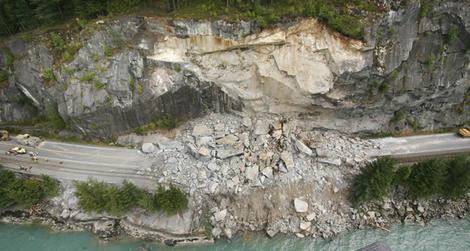
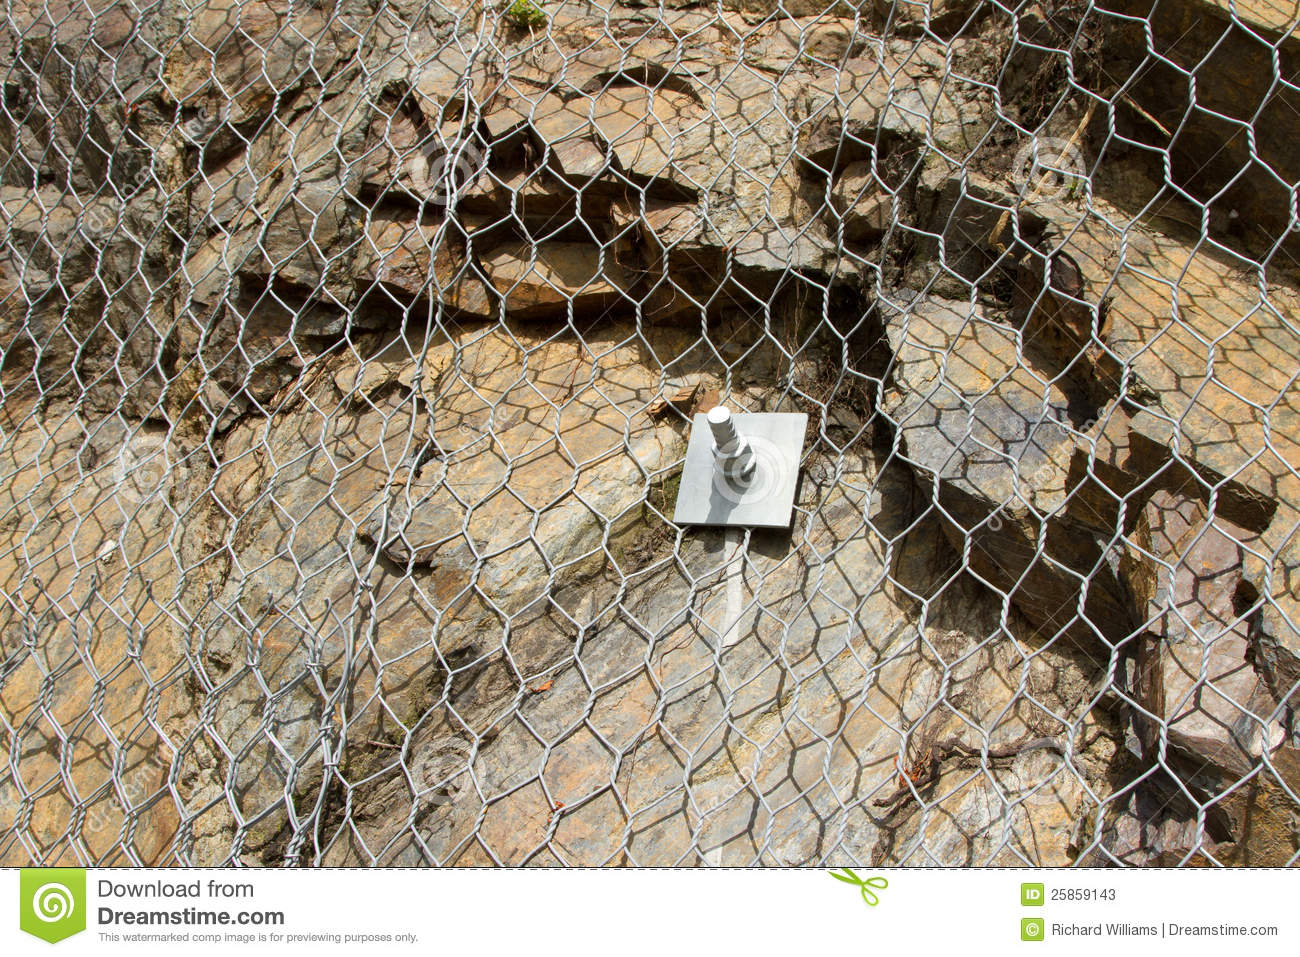
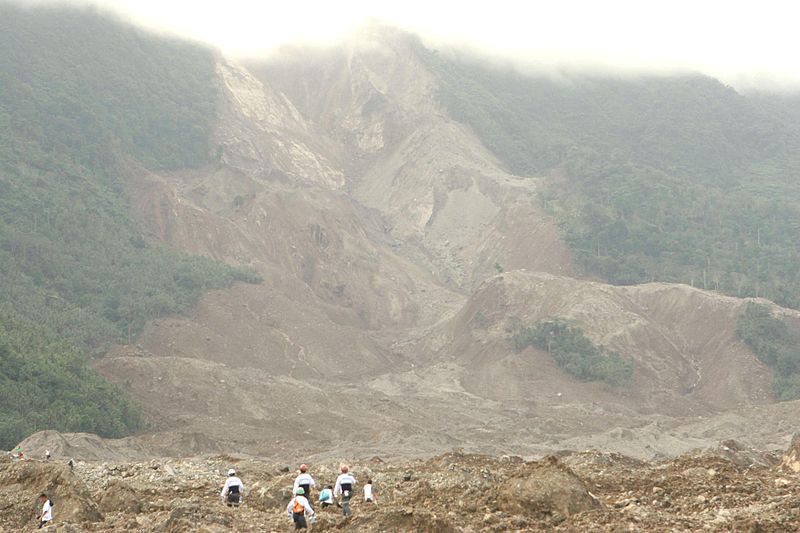
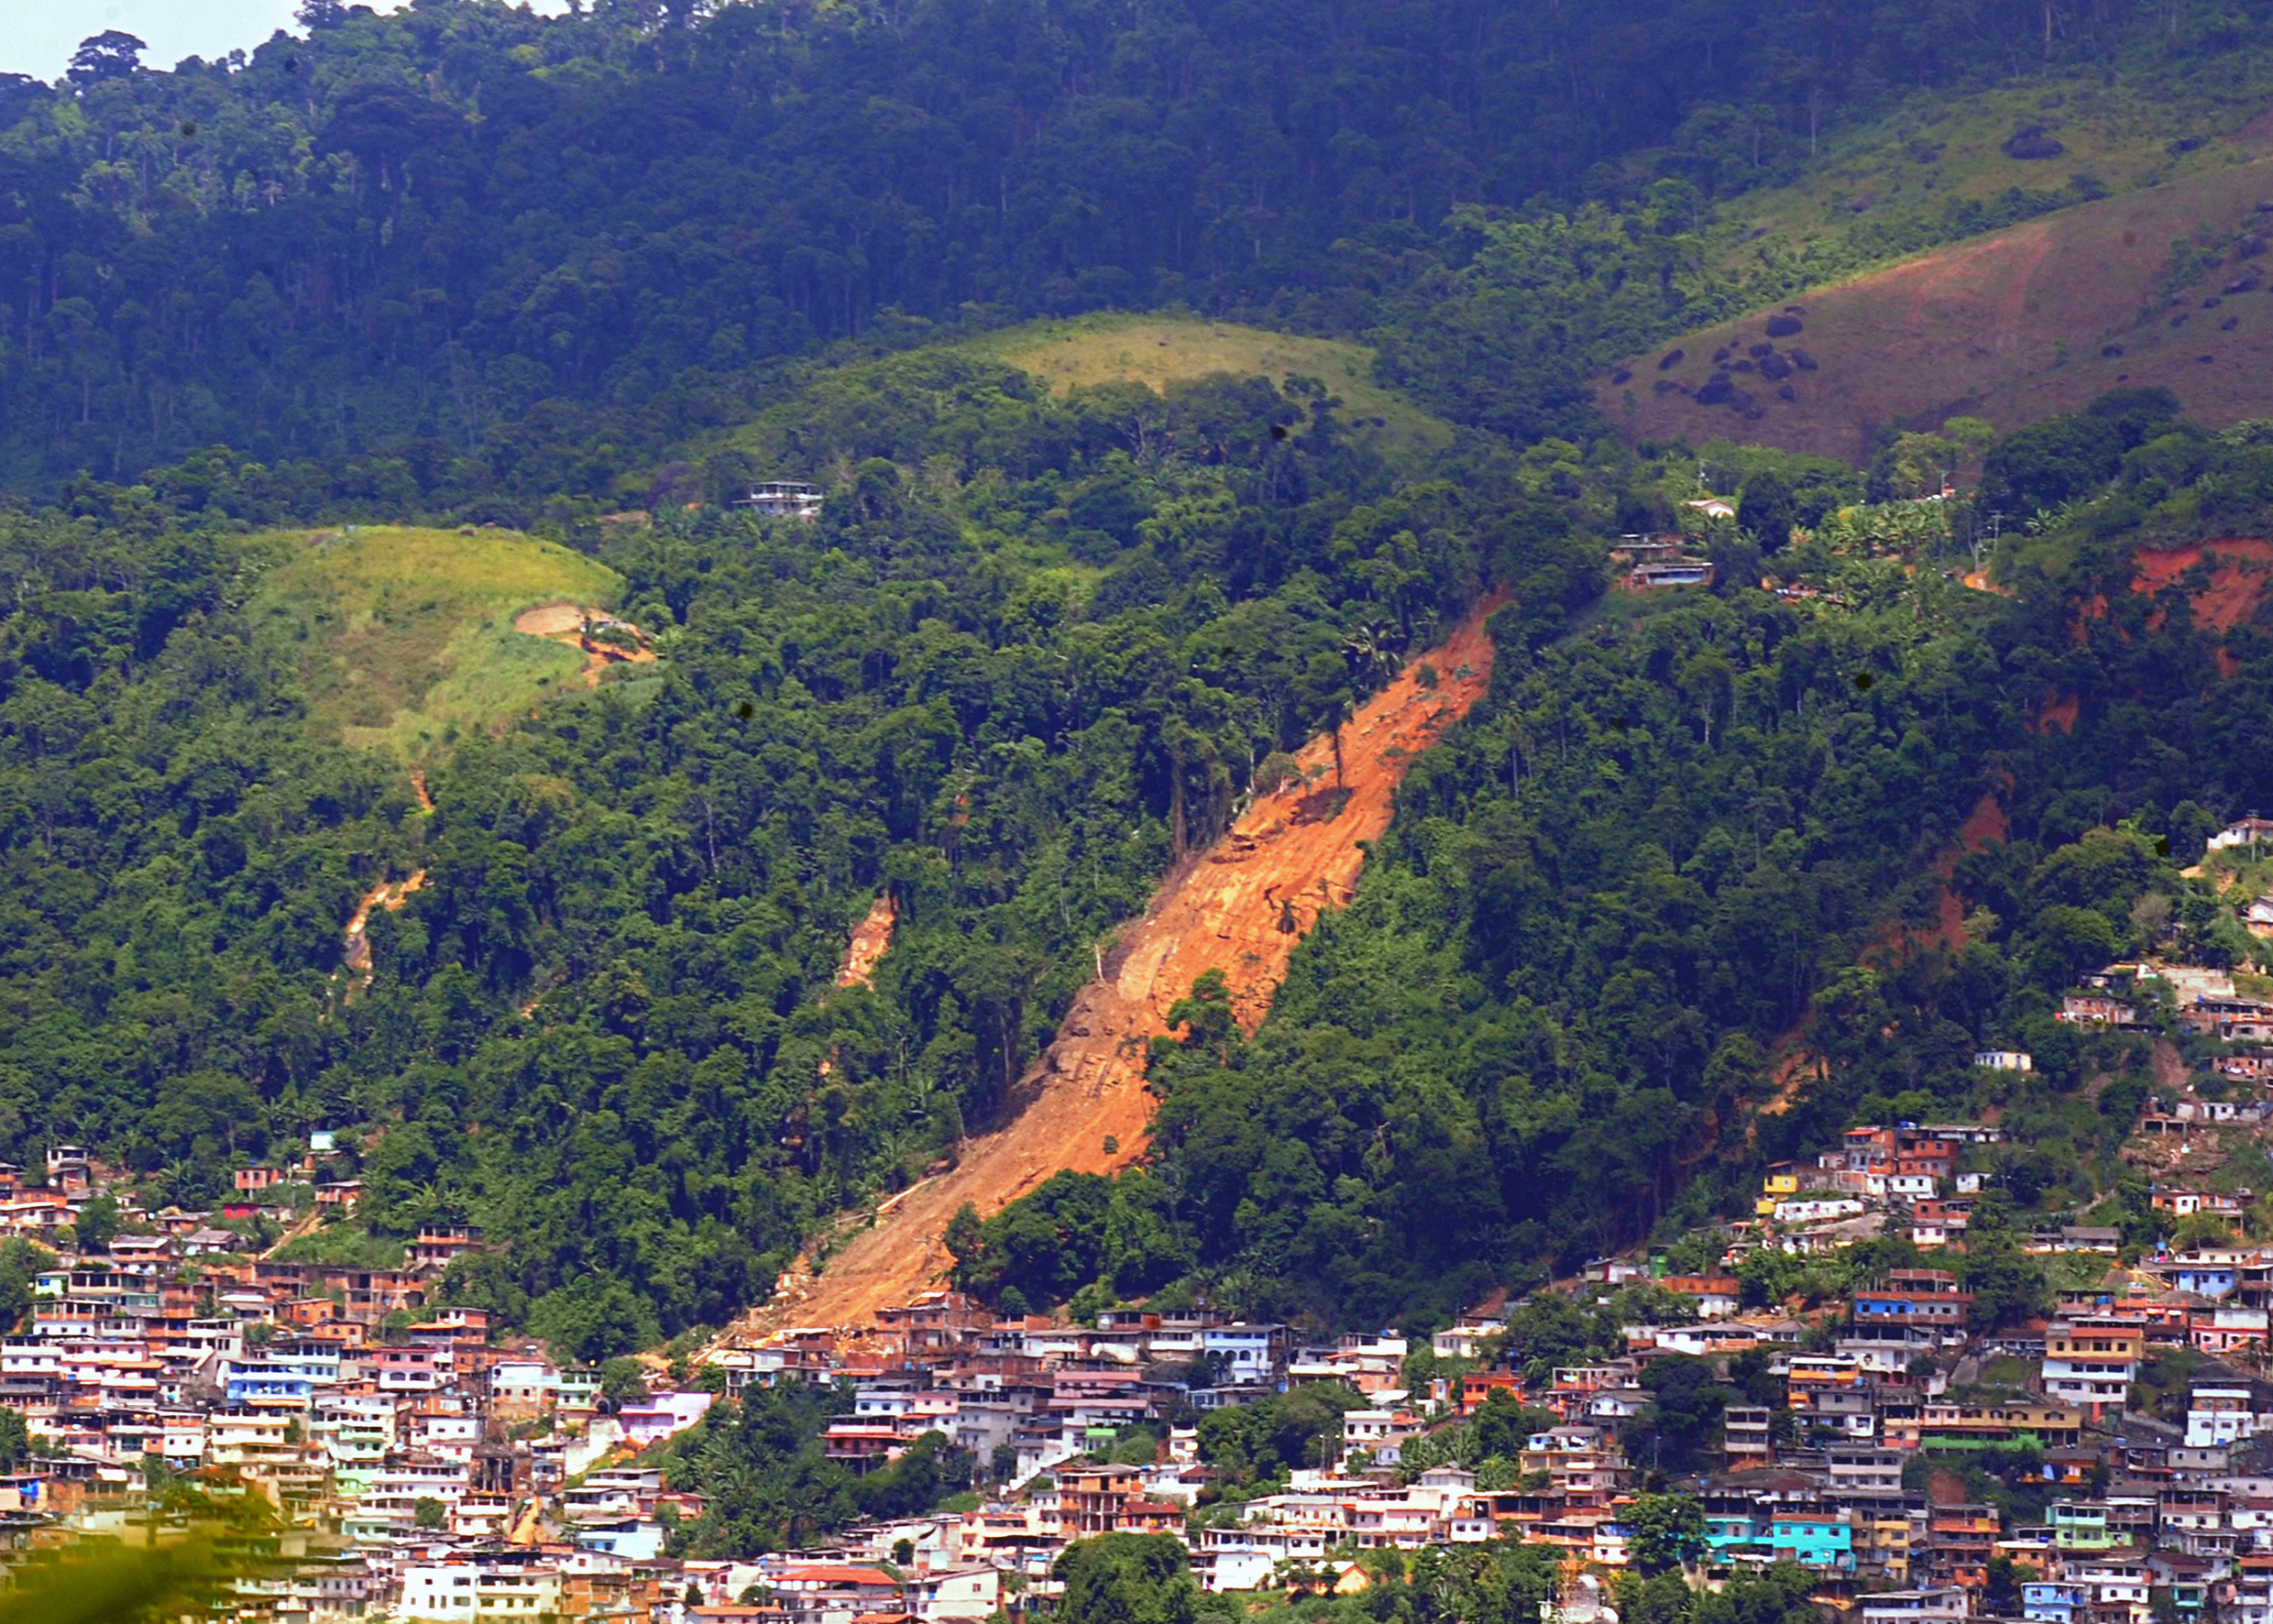
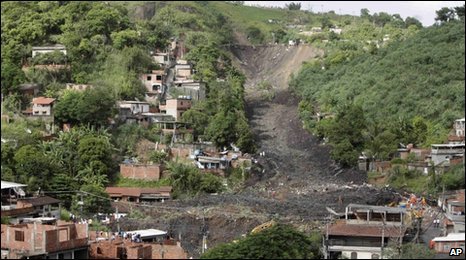
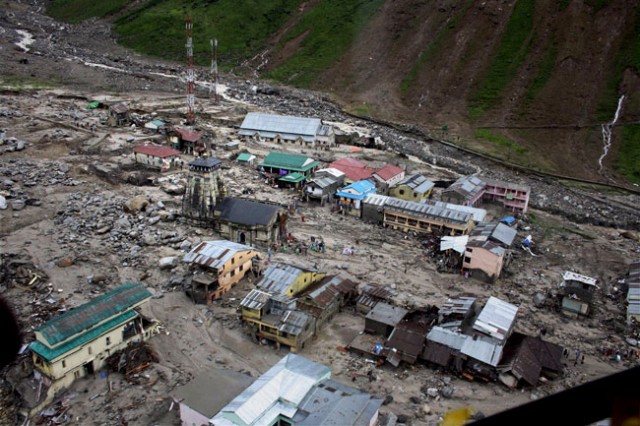
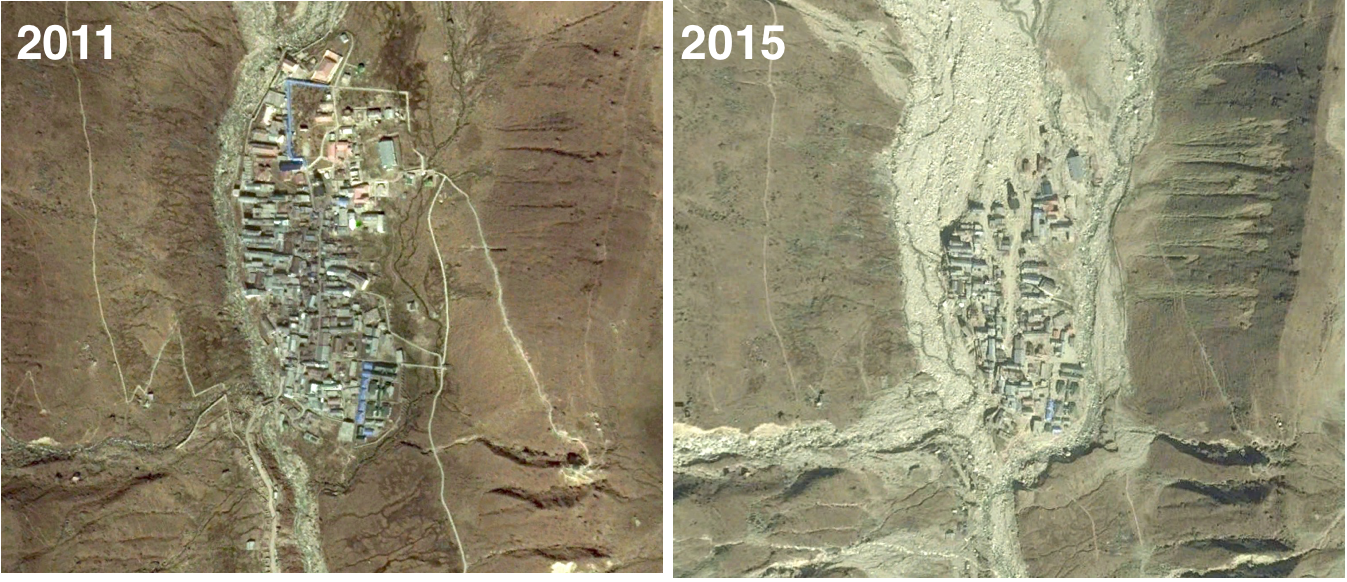
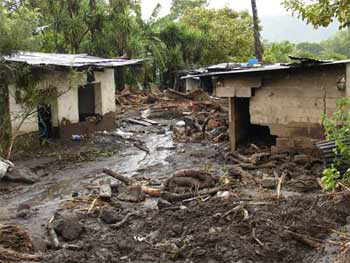
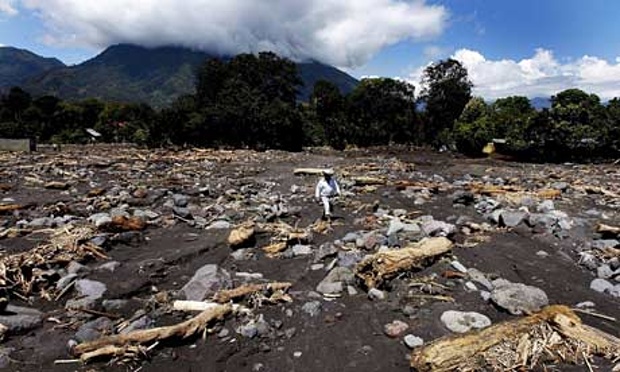
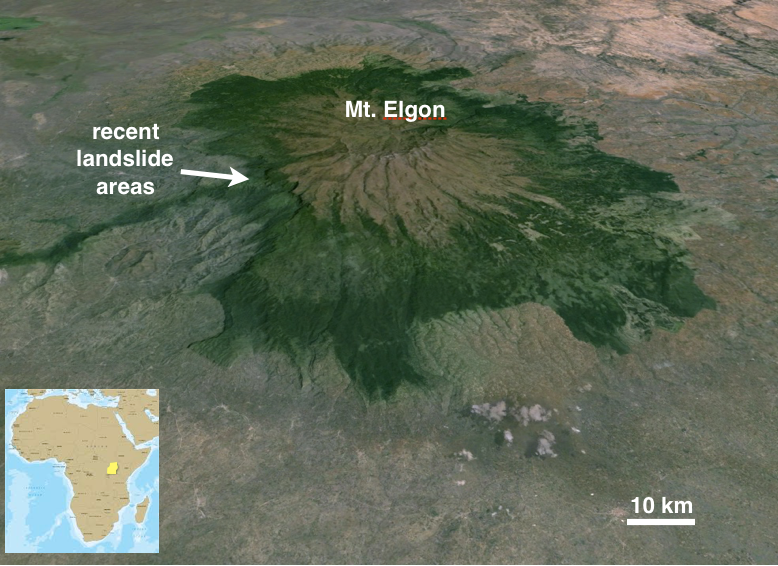
Reading ListWarfield, C., n.d., The Disaster Management Cycle. html. Back to ContentsClass 4: Geohazards; EarthquakesGeohazardsGeohazards are geological hazards that are associated with processes in the solid Earth's interior or at its surface. These hazards include earthquakes, volcanic activity, landslides, ground motion, and tsunamis. Some experts also include floods, droughts, meteorite impacts and the health hazards of geologic materials in geohazards, since they all involve processes at or under the Earth's surface. Many, but by far not all geohazards are related to plate tectonics. Geohazards are increasingly caused by human activities. For example, groundwater, oil and gas extraction can lead to surface subsidence impacting built infrastructure. It also can change the stress field and induce earthquakes. Fracking changes seismicity as well. Spatial scales of geohazards can range from local events such as a rock slide or coastal erosion to events that threaten the existence of humankind such as a supervolcano or meteorite impact. On temporal scales, geohazards range from rapid rock falls and short earthquakes over prolonged volcanic eruptions to slow slope motion and subsidence that can last for years and more. The sciences that are most relevant to study these hazards are geology, geophysics, and geochemistry. Geology is the science comprising the study of solid Earth, the rocks of which it is composed, and the processes by which it evolves. Geophysics applies physics to studying the planet, and originally it included meteorology and physical oceanography. Geochemistry studies the chemistry of the planet. For floods and droughts, meteorology, hydrology, and climatology are important, too. For meteorite impacts, astronomy is an important field. The geohazards can be grouped in those related to tectonics, ground instabilities and movements, anthropogenic ground instabilities, and other geological hazards:
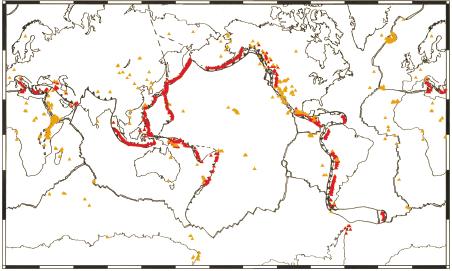
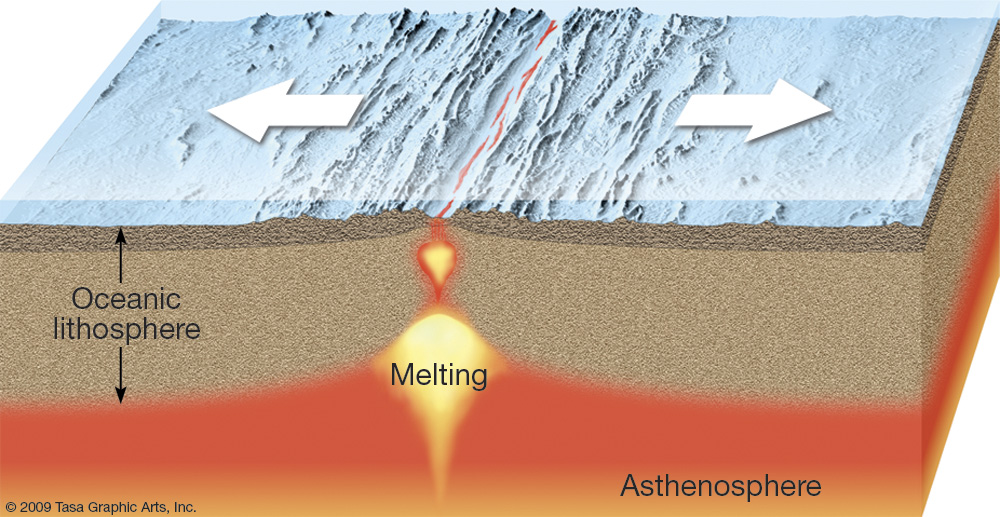
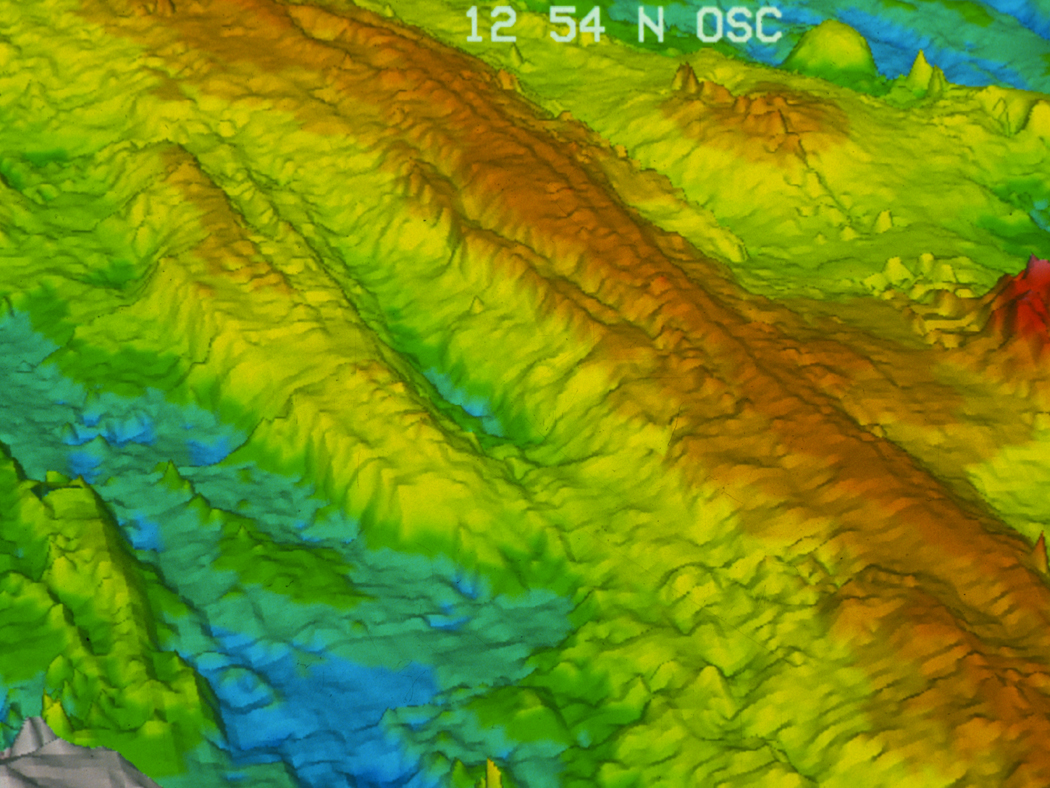
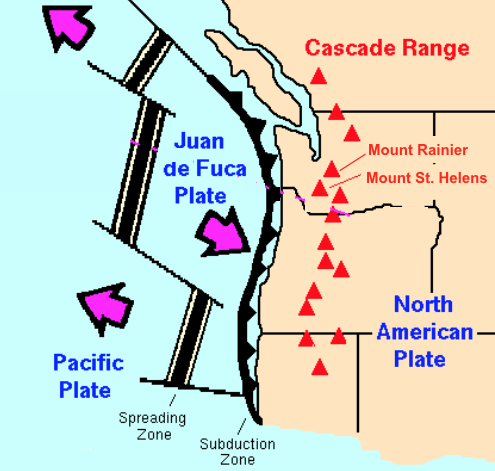
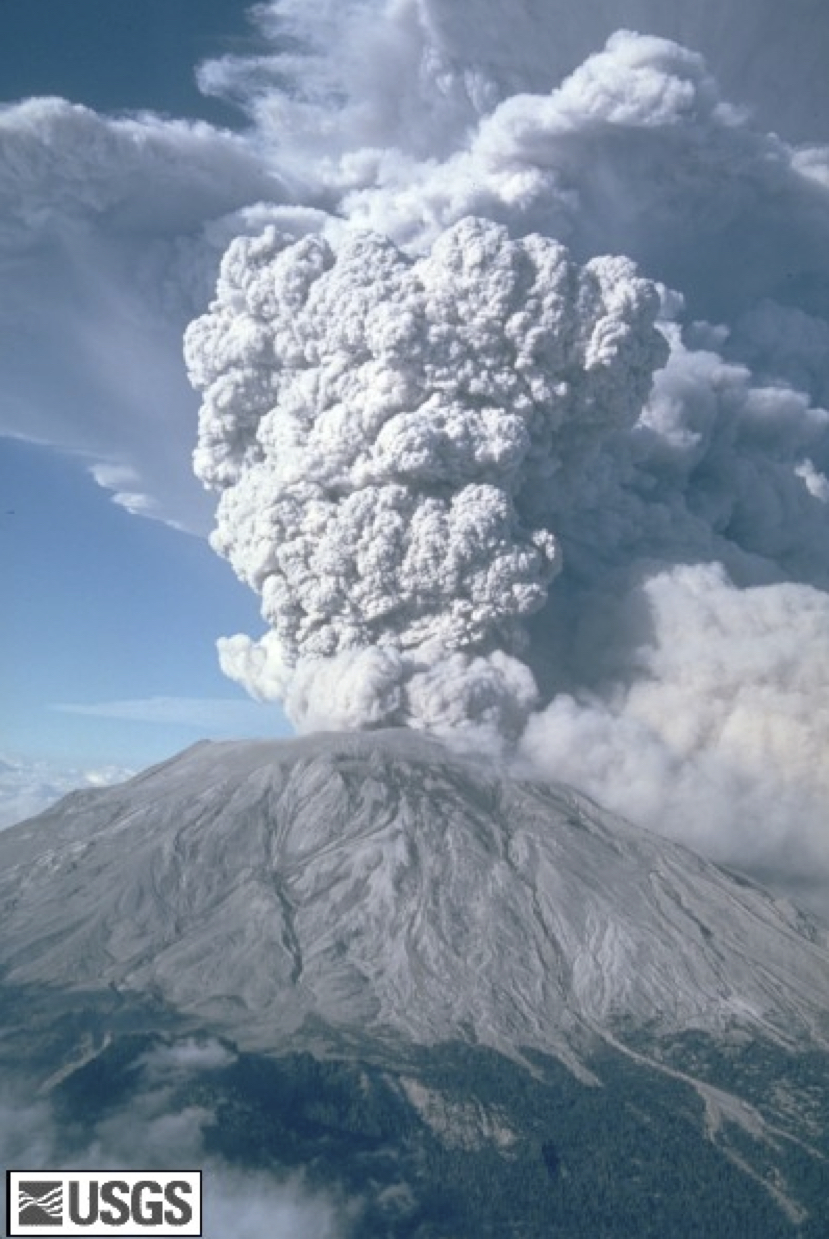
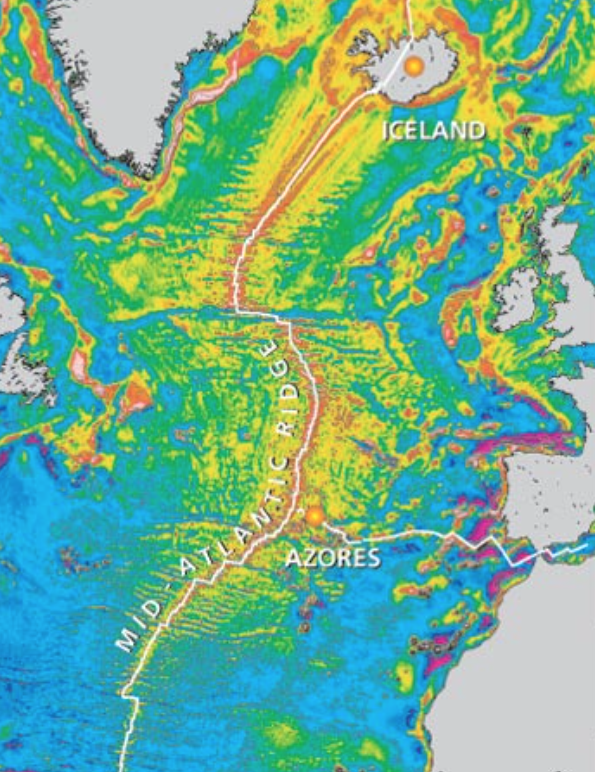
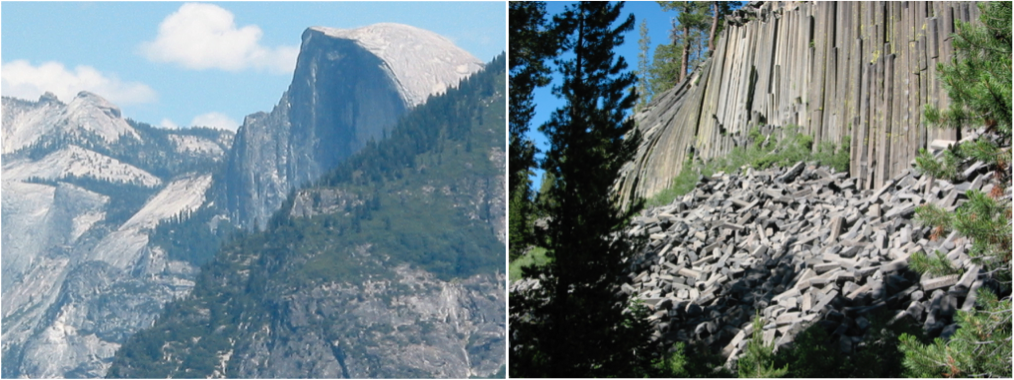
Plate TectonicsAlfred Wegener (1 Nov. 1880 - Nov. 1930) noted the similarity of the coast lines on both sides of the Atlantic, and he also found similar rocks on both sides of Atlantic. Based on this evidence, he published the idea of continental drift in 1912. However, the theory was not accepted because he could not provide an explanation of the forcing processes for moving the continents on Earth's surface. Long after his death in Greenland, new evidence for continental drift came from magnetic patterns on the ocean floor of the Atlantic ocean. These patterns could only be explained by a slow generation of the oceanic crust long the mid-Atlantic ridge and a slow drift of the crust away from the ridge. Today, continental drift, or plate tectonics, are well established paradigms in Earth sciences. Many of the phenomena of the solid Earth, the fluid envelope, and the biosphere direct result from plate tectonics. Earth's Internal StructureEarth's continental and ocean crusts are the thinnest, outermost layers of the planet. Earth's outermost crust, on which we live, is often described by analogy with an egg’s shell. Although high mountains and deep ocean trenches may seem enormous, on the scale of the planet as a whole they are almost unnoticeable wrinkles. The continental and oceanic crustal rocks and their underlying lithosphere, which together comprise the tectonic plates, are on average 100 km thick and for the most part they are rigid and brittle. Earth's lithosphere is chemically and mineralogically part of the upper mantle. Its rock is predominantly peridotite, which is a coarse-grained, dense, igneous rock that is high in iron and magnesium. Beneath the lithosphere is the asthenosphere, which although solid, is capable of flowing slowly due to its high temperature (1300°C). On the surface, the rock would melt at such high temperatures, but the high pressures at depth keep it in a solid state. Earthquakes are a main means for map Earth's internal structure. The seismic waves generated by earthquakes are useful for mapping Earth’s internal structure. Earthquakes and very large explosions release energy in the form of seismic waves that travel in all directions through the Earth, as well as along the crust’s surface. Seismic surface waves cause ground shaking and are responsible for most of the damage caused by earthquakes, but the different physical properties of compressional (P) and shear (S) seismic body waves are useful for mapping Earth’s internal structure. P-waves have a smaller amplitude, shorter wavelength, and travel faster than S-waves through Earth's crust, which is why they are the first to arrive at seismograph stations after an earthquake. However, unlike P-waves, the S-waves cannot travel through fluids and on the opposite side of Earth to an earthquake there is always a 'shadow zone,' within which no S-waves are received by seismographs. The recognition of this shadow zone allowed scientists to infer the existence of Earth's fluid outer core. Tectonic PlatesLithospheric plate boundaries are divergent, convergent, or transform, or a combination. Earthquakes and volcanic eruptions occur mainly because Earth’s lithospheric plates are constantly in motion. Relative to an Earth-fixed reference frame, they move with few exceptions with velocities of less than 10 cm/year and relative velocities between neighboring plates can reach up to 25 cm/year. When summed over thousands and millions of years, the plates can accomplish a great deal of motion. The three main types of plate boundary are: divergent, where plates move apart along mid-ocean spreading ridges; convergent, where one plate moves over the top of another; and, transform, where plates slide past one another. There are also more complex boundaries with a combination of different motion types. The boundaries and relative movement vectors of the larger plates are well-defined, but there are also dozens of micro-plates whose boundaries and relative motions are still the subject of research activity.
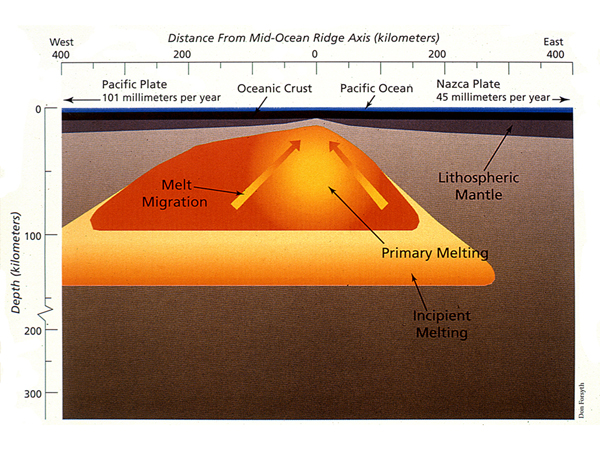
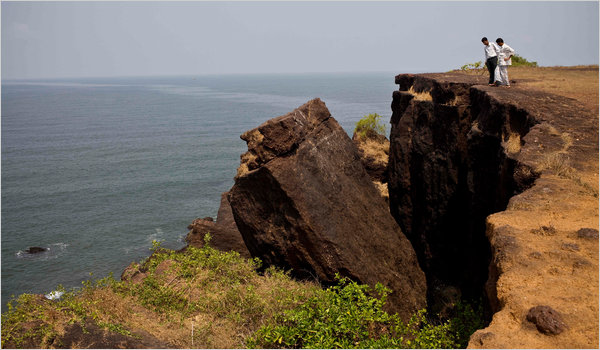
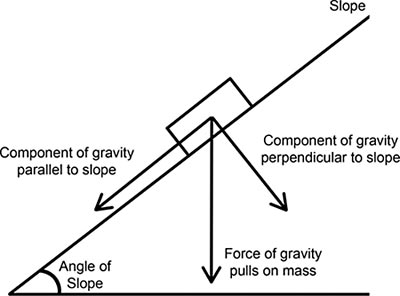
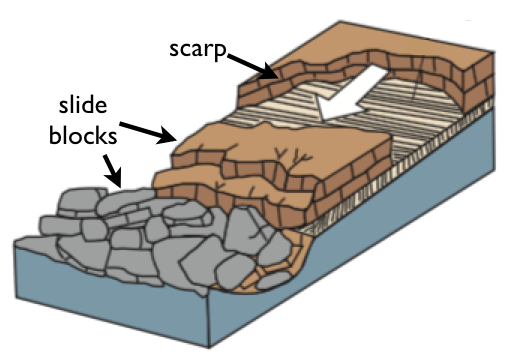
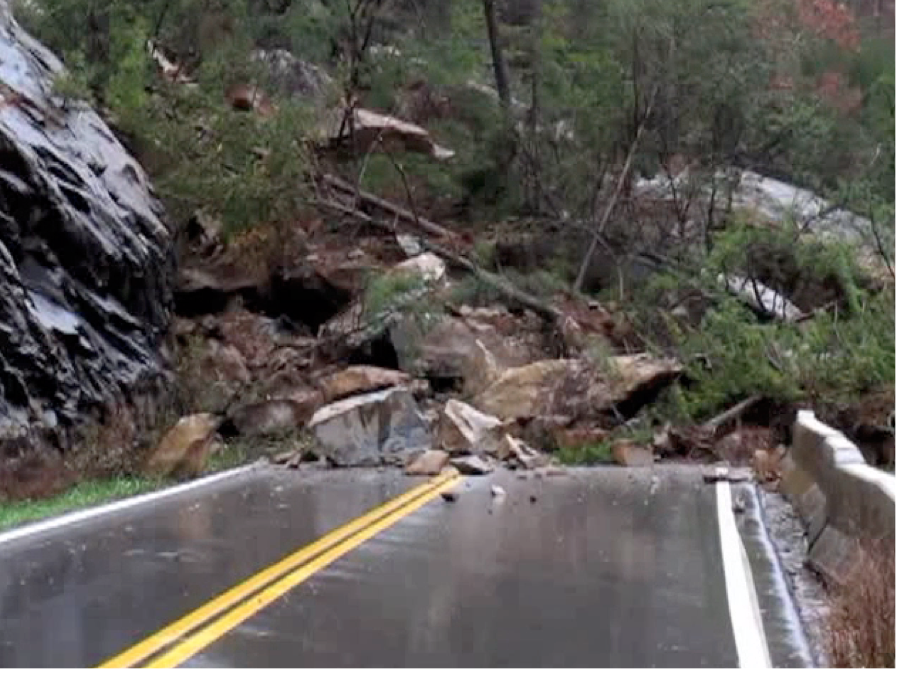
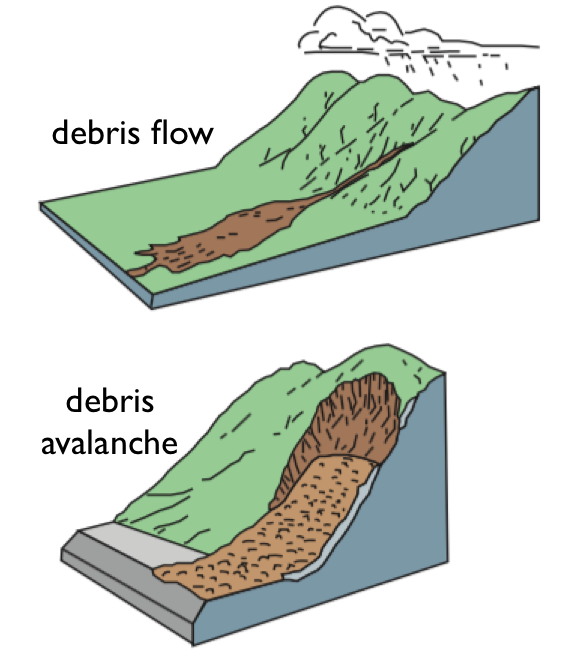
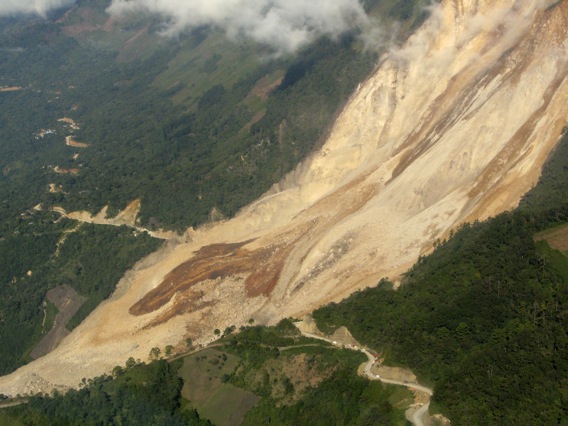
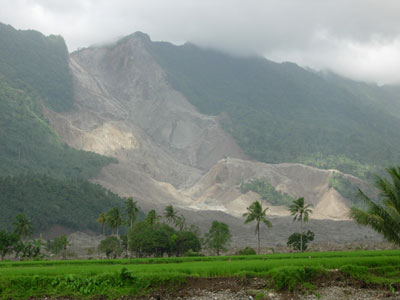
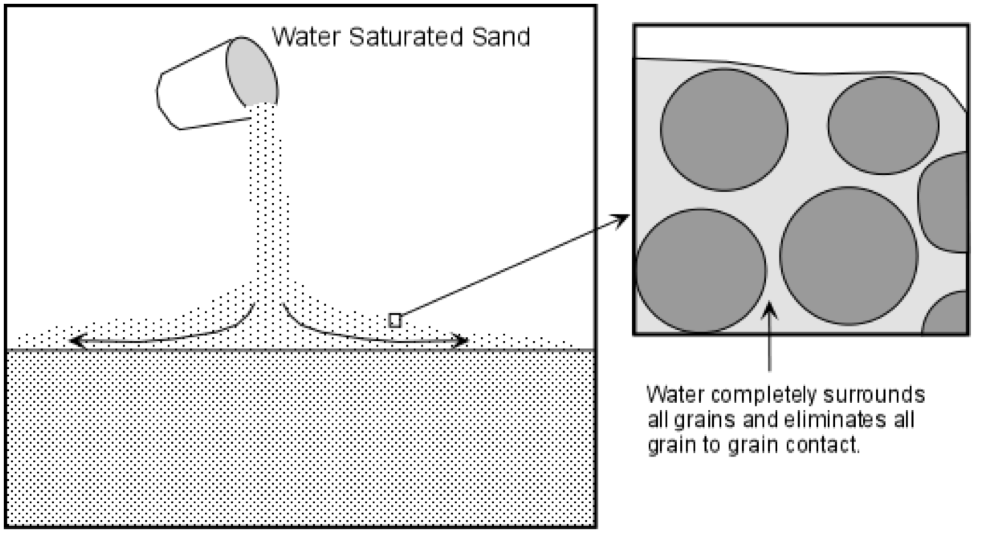
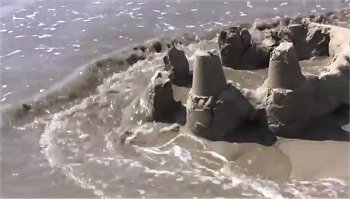
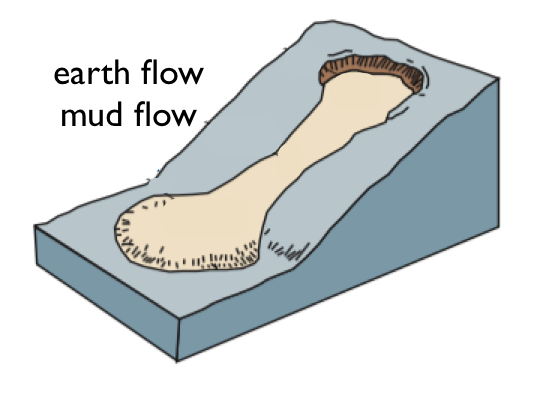
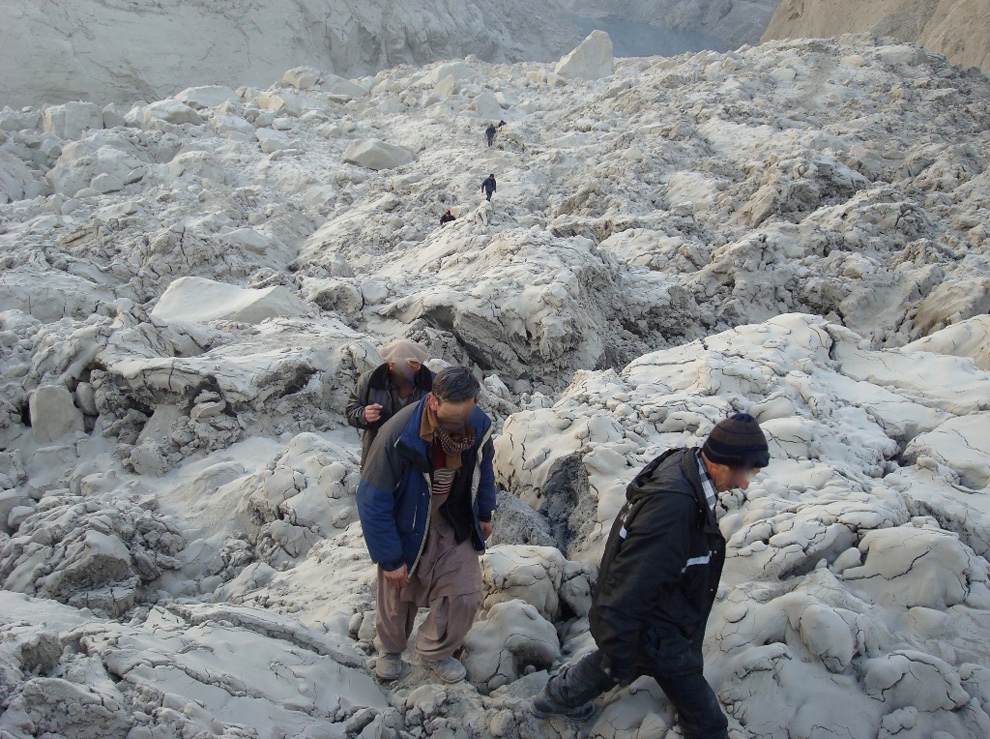
There are different processes forcing tectonic plate motion. Ridge push and slab pull are the two main driving forces for plate tectonics. Oceanic crust originates as basaltic magma in the upper mantle that is erupted at mid-ocean ridges. The basalt cools and thickens as the two sides of the ridge move slowly apart. At the same time, the uppermost asthenosphere under the new crust also cools, gradually creating an oceanic lithosphere that eventually reaches a thickness of 50 to 100 km. The dense oceanic lithosphere sags slightly into the underlying asthenosphere under the influence of gravity. This down-and-outward motion of the lithosphere, called 'ridge push,' is a major driving mechanism for plate motion. An even more important mechanism for plate motion than ridge push is 'slab pull,' which is where cold, dense slabs of old oceanic lithosphere sink back into the mantle down subduction zones, again under the influence of gravity. As the slab descends into the mantle it becomes heated and less rigid, eventually becoming almost indistinguishable from lower mantle. The combination of ridge push and slab pull, together with other, lesser driving forces, creates a circulating flow of material within the mantle that carries the overlying lithospheric plates along. Other Causes of GeohazardsProcesses at the Earth's surface can lead to geohazards. Rockfalls, landslides, and mudslides can move large masses due to instabilities and gravity downhill and cause devastation along their path. In certain geological conditions, sinkholes can open very suddenly and cause locally large damage and loss of lives. Skrinking and swelling clays can impact buildings and other infrastructure built on these clays. Soil liquefaction describes a phenomenon whereby a saturated or partially saturated soil substantially loses strength and stiffness in response to an applied stress, usually earthquake shaking or other sudden change in stress condition, causing it to behave like a liquid. Seismicity can be induced by loading (reservoirs), deloading (groundwater), as well as injection and extraction of subsurface material. Between the years 1973–2008, there was an average of 21 earthquakes of magnitude three and larger in the central and eastern United States. This rate has ballooned to over 600 M3+ earthquakes in 2014 and over 1000 in 2015. Through August 2016, over 500 M3+ earthquakes have occurred in 2016. See here for more detail on injection-induced seismicity EarthquakesAn earthquake is a sudden, violent shaking of the ground, usually caused by the fracturing of rock or movement of magma within Earth’s crust. Earth’s tectonic plates slowly and constantly readjust their positions and shapes in response to internal tectonic forces, and earthquakes are one of the consequences of this constant plate movement. Earthquakes occur when rock in the Earth’s crust breaks and moves suddenly in a fault zone. They are also caused by magma motion beneath volcanoes and during eruptions, and on the rare occasions when a meteorite hits Earth. Earthquakes occur most often along current and ancient plate boundaries, with the largest ones especially common on subduction and transform boundaries. However, they also occur, less frequently, in plate interiors. Destruction and casualties on a massive scale can result when a large earthquake happens beneath or very close to densely populated regions with infrastructure not built to resist the forces resulting from the ground motion. Disasters triggered by EarthquakesEarthquakes cause disasters mainly due to failing buildings and infrastructure. “Earthquakes don't kill people, buildings do!” (Bingham, 2011). The largest disasters caused by earthquakes are in areas where the built environment is not able to withstand the ground shaking. Failing buildings, resulting fires, or other casacading effects in the built environment lead to the largest disasters. For off-shore earthquakes, a resulting tsunami can cause a very large impact. The location of an earthquake is specified by:
Tectonic Plates are cool, thin and 'rigid,' relative to the hot, ductile mantle beneath. A plate consists of the crust and lithosphere, with the later being softer than the crust. Earthquakes occur within or between tectonic plates and within the upper mantle. Earthquakes cluster in three depth regions:
Most earthquakes occur on 'faults' or fracture zones in the Earth's crust when crustal rocks are stretched or slide past each other. When it breaks, it releases a sudden pulse of energy. Faults 'stick' as they slide past one another. The friction (resistance to sliding) causes stress to build up at sticking point. Most earthquakes occur on 'faults' or fracture zones in the Earth's crust when crustal rocks are stretched or slide past each other or above each other. Three main types of 'faults’'or fracture zones in the Earth's crust:
The magnitude of an earthquake is a number that characterizes the relative size of an earthquake. It is ased on measurement of the maximum motion recorded by a seismograph. There are several magnitude scales; most commonly used are:
The earthquake moment magnitude, Mw is uniformly applicable to all sizes of earthquakes but is more difficult to compute than the other types. It is based on the concept of: The moment magnitude Mw is a dimensionless value defined by Kanamori (1977) as Earthquakes with Mw of 2.5 or less are usually not flet but recorded by seismographs. They are frequent with more than 900,000 happening every year. Earthquakes with Mw between 2.5 and 5.4 are often felt and can cause minor local damage. Globally, on the order of 10,000 earthquake happen in this magnitude range. For Mw between 5.5 and 6.0, slight structural damage is likely and on the order of 500 of these earthquakes happen each year. In the Mw range between 6.1 and 6.9, significant structural damage can result often leading to loss of lives. On the order of 100 earthquakes happen annually in the magnitude range. Earthquakes in the Mw range of 7.0 to 7.9 are considered as major earthquakes that cause serious damage. If they happen on ocean floor, they can also cause local to regional tsunamis. On the order of 20 earthquakes happen annually in this range. Earthquakes with Mw of 8.0 and greater are great earthquakes that are extremely destructive. The impact of an earthquake of a given magnitude depends strongly on the depth of the hypocenter and also the mechanism of the earthquake. This is captured by the concept of earthquake intensity. Intensity is a number describing the severity of an earthquake in terms of its effects on the earth's surface and on humans and their structures. Several scales exist, but the ones most commonly used in the United States are:
The earthquake energy is released as a wave through the rocks. The wave has two components:
Importantly, P and S waves have different velocities. Seismographs record the arrival times of P and S waves. The P waves travel faster and arrive first. The waves also have different amplitudes. Surface waves have the largest amplitudes and they cause the largest ground shaking and subsequent damage. Since the wave velocity within the Earth's interior depends on the depth, and is in general higher deeper inside the Earth, surface waves arrive after the P and S waves, that travel through the interior, which gives very short times as early warning. The recurrence interval Tr is the average time between two earthquakes of a given magnitude. It gives an indication how likely an earthquake of this magnitude is in a given location. Seismic hazard maps are based on recurrence intervals for large earthquakes. Convergent boundaries can have
At transform boundaries (e.g., California, New Zealand), earthquakes are mostly at shallow depth, but can have large magnitude and cause destructive ground shaking. Class Reading List:PanGEO, n.d., What are Geohazards? html Kious, W. J., Tilling, R. I., 1996. “Historical perspective”. This Dynamic Earth: the Story of Plate Tectonics (Online ed.). U.S. Geological Survey. ISBN0-16-048220-8. Murphy, J. B., van Andel, T. H., 2017. Plate Tectonics. Encyclopaedia Britannica, html. Wikipedia, n.d., Plate Tectonics. html National Geographic, n.d., Plate Tectonics. html. Bolt, B. A., 2017. Earthquake. Encyclopaedia Britannica, html The Editors of Encyclopædia Britannica, 2017. Notable Earthquakes in History. Encyclopaedia Britannica, html. Plag, H.-P., Brocklebank, S., Brosnan, D., Campus, P., Cloetingh, S., Jules-Plag, S., Stein, S., 2015. Extreme Geohazards — Reducing the Disaster Risk and Increasing Resilience. European Science Foundation. pdf. Back to ContentsClass 5: Disasters triggered by EarthquakesCONTENTSMagnitude and LocationsLarge to extreme earthquakes during the last 2000 years (see for example Table x in Plag et al., 2015) illustrate the destruction they can inflict directly and indirectly through tsunamis. The resulting disasters are amplified in areas with poor building infrastructure. As a consequence, the earthquakes with the largest magnitude do not necessarily cause most fatalities or greatest damage. Earthquakes cause disasters mainly due to failing buildings and infrastructure. “Earthquakes don't kill people, buildings do!” The largest disasters caused by earthquakes are in areas where the built environment is not able to withstand the ground shaking. Failing buildings, resulting fires, or other casacading effects in the built environment lead to the largest disasters. For off-shore earthquakes, a resulting tsunami can cause a very large impact. In general, poor countries exposed to the same level of hazards as more developed countries experience a disproportinate number of disasters. Poverty, often paired with corruption, can turn hazards into disasters, and the means to increase preparedness and resilience are not sufficiently available in areas with high degrees of poverty. The largest disasters caused by earthquakes took place in regions with poor building infrastructure. While the largest earthquakes occur at continental plate boundaries, the largest disasters triggered by earthquakes mostly occur within plates. CasesCase 1: Deadliest earthquake on record: 23 January 1556 in Shaanxi, Mw=7.9-8.0, I-XI, Depth unknown. Deaths 820,000-830,000 The 1556 Shaanxi earthquake or Huaxian earthquake was a catastrophic earthquake and is also the deadliest earthquake on record, killing approximately 830,000 people. An area 840 km wide was destroyed, and in some counties as much as 60% of the population was killed. Most of the population in the area at the time lived in yaodongs, artificial caves in loess cliffs, many of which collapsed with catastrophic loss of life. The epicenter was in the Wei River Valley in Shaanxi Province, near the cities of Huaxian, Weinan and Huayin. In Huaxian, every single building and home was demolished, killing more than half the residents of the city, with a death toll estimated in the hundreds of thousands. The situation in Weinan and Huayin was similar. In certain areas, crevices 20 m deep opened. Landslides contributed to the death toll. Case 2: Apr. 18, 1906 San Francisco, Mw=7.9, I=XI, Depth 8 km, Deaths 700 - 3,000 San Francisco earthquake of 1906, major earthquake with a magnitude of 7.9 that occurred on April 18, 1906, at 5:12 am off the northern California coast. The San Andreas Fault slipped along a segment about 270 miles (430 km) long, extending from San Juan Bautista in San Benito county to Humboldt county and from there perhaps out under the sea to an unknown distance. The shaking was felt from Los Angeles in the south to Coos Bay, Oregon, in the north. Damage was severe in San Francisco and in other towns situated near the fault, including San Jose, Salinas, and Santa Rosa. (britannica.com). Case 3: Sep. 19, 1985 Mexico City, Mw=8.0, I=IX, Depth 20 km, Deaths 10,000 (up to 45,000). The central city, constructed on the dry bed of the drained Lake Texcoco, endured the heaviest shaking because loose lacustrine sediments amplified the shock waves. The ground motion in this area measured five times that in the outlying districts, which had different soil foundations. Buildings of 5 to 15 stories were most affected, as their interaction with the shock waves created a harmonic resonance, exacerbating the degree of swaying. More than 400 buildings collapsed, and thousands more were damaged. (britannica.com). Case 4: Jan. 17, 1995, Kobe, Japan, Mw=6.9, I=XI Depth 17.6 km, Deaths 5,502-6,400, Damage $200 billion Damage was extremely widespread and severe. Structures irreparably damaged by the quake included nearly 400,000 buildings,[3][12] numerous elevated road and rail bridges, and 120 of the 150 quays in the port of Kobe. The quake triggered around 300 fires,[3] which raged over large portions of the city. Disruptions of water, electricity and gas supplies were extremely common. Case 5: Oct. 8, 2005, Azad Kashmir, Mw=7.6, I=VIII, Depth 26 km Deaths 86,000 to 87,000, Damage $5.2 billion The official death toll was 79,000 for Pakistani-administered Kashmir and the NWFP, although other sources put it at 86,000, with the number injured estimated at more than 69,000. At least 1,350 people were killed and 6,266 injured in Jammu and Kashmir state in India, and the tremors were felt at a distance of up to 620 miles (1,000 km), as far away as Delhi and Punjab in northern India. Four fatalities and 14 injured survivors were reported in Afghanistan. The property loss caused by the quake left an estimated four million area residents homeless. The severity of the damage and the high number of fatalities were exacerbated by poor construction in the affected areas. (britannica.com) Case 6: Jan. 12, 2010, Haiti, Mw=7.0, I=VIII, Depth 13 km Deaths 80,000 to 315,000 The earthquake was generated by contractional deformation along the Léogâne fault, a small hidden thrust fault discovered underneath the city of Léogâne. The Léogâne fault, which cannot be observed at the surface, descends northward at an oblique angle away from the Enriquillo–Plantain Garden (EPG) strike-slip fault system, and many geologists contend that the earthquake resulted from the slippage of rock upward across its plane of fracture. Case 7: Apr. 6, 2009, L’Aquila M 6.1, I=VIII, Depth 9.5 km Deaths 309, Damage $16 billion The L'Aquila earthquake occurred in the region of Abruzzo, in central Italy. The epicentre near L'Aquila, the capital of Abruzzo, which together with surrounding villages suffered most damage. There were several thousand foreshocks and aftershocks since December 2008, more than thirty of which had magnitude greater than 3.5. 309 people are known to have died, making this the deadliest earthquake to hit Italy since the 1980 Irpinia earthquake. Extreme EventsFor extreme events, the questions of how big, how bad, how often are difficult to answer because these events are rare and statistics are not readily available. Knowledge of rare events is limited. The knowledge of the “why” and “how” is often better developed than knowledge on the “when”. The probability is difficult to assess, which makes risk assessment challenging. What can be summarized is that earthquakes do not kill people, but buildings (corruption, irresponsibility, ignorance …). In general, geohazards cannot be reduced, but vulnerability of the built environment can be greatly reduced. Reducing predictive uncertainties in geohazard research and enhancing modeling capabilities also can contribute to make risk assessments a better basis for the planning of the built environment. Dealing with multiple and/or sequential events can be a challenge. To address this, developing a trans-disciplinary link and research is important. Links between science and policy-makers, media and insurances are also crucial for risk management and disaster reduction. Enhancing science education and improving awareness on extreme hazards and disaster risk further can increase preparedness and reduce the disaster risk. Managing Disaster RiskThe design of critical coastal infrastructure is often based on unjustifiably long recurrence intervals for these extreme events. A scenario-based assessment of the tsunami hazard can provide more insight and guidance for the planning of coastal infrastructure. Direct impacts of tsunamis are restricted to coastal zones, while indirect and cascading effects can reach regional and global scales. Mitigation of tsunami impacts is more a local problem, which require local governments to assess the threat, increase awareness and develop resilience plans. Large tsunamis like the one triggered by the May 22, 1960 Chile Earthquake, the March 27, 1964 Alaskan Good Friday earthquake, the December 26, 2004 Sumatra-Andaman earthquake or the March 11, 2011 Tohoku earthquake generated waves, which killed people thousands of kilometers away from the epicenter. The catastrophic effects of such tsunamis prompted governments to develop both local resilience plans and to progress in the establishment of tsunami warning centers across the globe. TsunamisTsunamis are waves in the ocean or large lakes that can be immensely destructive when they reach the shores and can destroy vast coastal regions. Earthquakes, landslides, and rockfalls can cause tsunamis in the ocean or in lakes. The extent of destruction a tsunami causes depends, among other factors, on the local population and infrastructure in the coastal region impacted by a tsunami. Class Reading ListIntergovernmental Oceanographic Commission. 2014. Tsunami, The Great Waves, Revised Edition. Paris, UNESCO, 16 pp., illus. IOC Brochure 2012-4. (English.), revised 2014. Language versions at: http://unesdoc.unesco.org/ulis/cgi-bin/ulis.pl?lin=1&catno=148609. pdf. Bernard, E. N., n.d. The Tsunami Story. NOAA, http://www.tsunami.noaa.gov/tsunami_story.html. Back to ContentsLab 5: Earthquake epicentersThe lab first reviews terminology for earthquakes and considers characteristics of the Earth's interior. The lab will then discuss two exercises. In the first exercise, three seismogram will be used to determine the epicenter of the Loma Prieta earthquake and then to estimate the earthquake magnitude. The second exercise consists of a number of questions concernig the 2010 Haiti earthquake. In the lab, the exercises will be discussed in detail. The students will then have time until October 5, 2018 6:00 PM to send the solutions for these exercise to the instructor. For details on the exercises see the lab slides. Class 6: VolcanoesVolcanoesVolcanoes are localized places where molten rock and ash mingled with toxic gases and steam erupts onto the surface of the Earth or other planetary bodies. On Earth, active volcanoes are located on divergent or convergent plate boundaries, or above isolated 'hot spots' in the Earth's mantle. Dictionary definitions of 'volcano; generally state that they are cone-shaped mountains with a crater or vent from which magma (molten rock), gases, and hot rocks are ejected. This simple definition fits most people’s idea of a volcano (Fig. 1a), even though many volcanoes are not conical, not all volcanoes are active, and not all eruptive vents in the crust form volcanoes. The majority of visibly active volcanoes are located on convergent plate boundaries (Fig. 1b), such as as the Ring Of Fire around the Pacific Ocean. Chains of submarine volcanoes also comprise Earth’s mid-ocean ridges. Other volcanoes sit above 'hot spots,' areas of localized high heat flow from Earth's mantle that are not necessarily associated with present day plate boundaries.
Active vs. DormentActive volcanoes are erupting, show signs of imminent eruption, or have recently erupted. Dormant volcanoes have not erupted in historic times, but that does not mean they are extinct. There is no hard line between an active and a dormant volcano. There are over 500 active volcanoes on Earth that are either currently erupting or have an historical record of eruptions. Their current activity may range from seemingly harmless gaseous emissions and small earthquakes (Fig. 2a) to an explosive eruption of hot rocks, ash, and lava (magma that has reached the surface). If there have been no recent eruptions, but there remains a likelihood of future activity, the volcano is said to be dormant (Fig. 2b). Dormant volcanoes can be among the most deadly, as people may become complacent about the dangers of a new eruption. Volcanoes are only considered extinct when there is no longer any indication of magma moving beneath them and the chance of another eruption is essentially zero.
Types of VolcanoesThe composition of a volcano’s lava determines its shape and its behavior. Broad shield volcanoes form relatively quietly from fluid, silica-poor basaltic lava. Silica-rich lava is viscous and builds into conical stratovolcanoes that erupt violently. Lava that forms into rocks of the ocean crust differs chemically and in its physical behavior from lava that erupts from volcanoes above subduction zones. Ocean crust lavas have a basaltic composition, with a high iron and magnesium content and a low silica content, which makes them very fluid. They often form spectacular fountains and lava rivers during eruptions and create broad, low-elevation hills known as shield volcanoes (Fig. 3a). Volcanoes above subduction zones extrude silicarich, iron-poor lavas that are very viscous and can range widely in composition. The layers (strata) of lava and ash build into composite, steep-sided, cone-shaped volcanoes known as stratovolcanoes (Fig. 3b). Although the sticky lava does not flow far from its vent, these volcanoes often erupt huge amounts of volcanic ash in violent explosions.
Mid-Ocean Ridge VolcanoesMagma eruptions on divergent plate boundaries are rarely noticeable, yet they have produced extremely long submarine mountain ranges known as mid-ocean ridges. New oceanic crust forms along divergent plate boundaries (Fig. 4a) by the frequent extrusion of basaltic lava from central underwater fissures that separate the two lithospheric plates. Hot magma beneath the plate boundary migrates toward the central fissure (Fig. 4b), slightly elevating the ocean crust’s surface. As the quietly extruded lava solidifies, the resulting basaltic rock forms long, narrow, volcanic ridges (Fig. 4c). The center line of the ridge splits apart with each new eruption, with the result that a symmetrical pattern is created on either side of the fissure as the rocks on one side move gradually away from those on the other side. These linear volcanic ridges link to form a 60,000 km-long, underwater mid-ocean mountain range that includes the Mid-Atlantic Ridge and the East Pacific Rise, among others.
Basaltic Shield VolcanoesBasaltic lava is very fluid and builds broad, lowelevation volcanoes. The lava can travel long distances as lava rivers on surface and through tubes under the solidified surface crust. Basaltic lava has a low viscosity that allows it to flow easily in lava rivers and lobes, gradually building up shield volcanoes. Active shield volcanoes, such as those on Hawaii, erupt frequently and do pose a hazard (Fig. 5a), but usually give warning of an impending eruption through micro-earthquake activity and an increase in gas emissions before the lava erupts. On contact with the atmosphere or water, the surface skin of the lava cools and solidifies into a black basalt rock crust that insulates the still molten lava below. Under the crust, lava continues to flow (Fig. 5b) until it cools, becomes more viscous, and finally stops moving. Lava tubes under the surface (Fig. 5c) act as conduits that feed the front of the flow, keeping the lava moving until they, too, finally cool and solidify.
The Hawaiian Island ChainThe Hawaiian Islands formed above a mantle hot spot and are composed of active, dormant, and extinct volcanoes, with the active ones forming the easternmost islands. Although they are in the middle of the Pacific Ocean, the Hawaiian Islands did not form above a divergent plate boundary. The islands are the youngest of a chain of basaltic shield volcanoes and seamounts in the Pacific Ocean that becomes progressively older westward, away from Hawai’i, and extends 5,800 km to Kamchatka, Russia (Fig. 6a). Each of the more than 80 volcanoes in the chain is thought to have formed above the same localized ‘hot spot’ plume of magma which rises from the mantle (Fig. 6b) through the oceanic crust and is currently located beneath Hawai’i. There are currently four active volcanoes on the Hawaiian Islands. A fifth active volcano, Lo’ihi, is growing underwater on the eastern flanks of Kilauea and Mauna Loa. Although its summit is still more than 900 m below sea level, Lo’ihi is poised to become the newest Hawaiian Island.
Active Hawaiian VolcanoesThe frequent eruptions from Kilauea and Mauna Loa cause destruction of roads, farmland, and property on the Hawaiian islands. One of the most active volcanoes anywhere in the world is Kilauea, on the island of Hawai’i. More than 60 separate eruptions have been recorded over the past 250 years and there have been eruptions somewhere on or around the volcano non-stop since 1983 (Fig. 7a). Kilauea’s neighboring volcano, Mauna Loa is the world’s largest active volcano. It has erupted 15 times since 1900 although only twice since 1950, in 1975 and 1984, which causes volcanologists to consider it due for another eruption. Nearby Hualalai last erupted in 1801 and is being monitored by geologists in case it shows signs of new activity. Haleakalā (Fig. 7b), on the island of Maui, is also considered active. Its most recent eruption occurred between 200 and 500 years ago and it is also under constant surveillance.
StratovolcanoesStratovolcanoes, also called composite volcanoes, are highly dangerous. They can explosively erupt ash, fast-moving pyroclastic flows, and lava. Volcanoes that form along subduction zones have viscous, silica-rich lava that originates as magma in the mantle above the subducting plate (Fig. V8a). Three of the most common varieties of this type of lava are called rhyolite, dacite, and andesite (after the Andes mountains). These lavas do not flow easily and can clog the volcano’s conduits. Gas becomes trapped in the lava, eventually creating explosive bursts of hot ash, gas, and rock fragments called pyroclastic flows that build a composite stratovolcano (Fig. 8a). The sticky lava that flows from the volcano’s vents cannot travel very far, however pyroclastic flows are fluid and can travel many kilometers. Volcanic ash from stratovolcanic eruptions is often voluminous (Fig. 8b), thickly blanketing broad regions downwind and falling in lesser amounts hundreds or even thousands of kilometers away.
Pyroclastic FlowsPyroclastic flows are highly dangerous, extremely fast-moving avalanches of hot gas, lava, and rock. As sticky, silica-rich magma rises to the surface it reaches a point where the surrounding rock no longer provides enough pressure to keep gases dissolved in the magma. Rapidly degassing magma can generate an explosive outpouring of rock fragments, molten lava globules, pumice (frothy lava), ash, steam, and toxic gases at temperatures of up to 800°C. This outburst becomes a dense, hot avalanche known as a pyroclastic flow (Fig. 9a). Hot gases in the pyroclastic flow at first continue to expand, keeping the solid particles in suspension – a process called fluidization. The dense mixture surges down the volcano’s flank at up to 200m per second, hugging the ground (Fig. 9b) and following valleys (Unzen, Japan, Pyroclastic Flow 2010). Eventually, often after tens of kilometers, the mixture cools, the suspended particles solidify and fuse, and the flow stops.
TephraExplosive eruptions produce pulverized lava and rock fragments, called tephra. Large blocks are called volcanic bombs. Fine tephra particles form ash plumes and ash clouds. Explosive expansion of hot gases from volatile-rich magmas pulverizes the rocks around the volcanic vent into fragments, called tephra, and forces them out of the volcano at ballistic speeds (up to 200 m per second). Large blocks, called bombs, land close to the vent (Fig. 10a), but the hot gases carry millimeter-sized and smaller particles, known as ash, in plumes that reach high altitude before spreading to form an ash cloud (Fig. 10b). Lightning bolts are caused by electrically charged wet ash in the cloud (Fig. 10c). The ash is deposited downwind from the volcano, with the thickest deposits nearest the vent. Where an ash plume extends to the upper atmosphere or stratosphere, the particles are kept aloft by high altitude winds and may circle the Earth for months or years, sometimes noticeably dimming sunlight.
Plumes And AircraftAsh plumes and ash clouds from volcanic eruptions have caused aircraft engine failure. Intersection with a thick ash cloud from Mount Galunggung volcano, near Jakarta, Indonesia, caused all 4 jet engines to fail on British Airways Flight #9 on June 24, 1982 (Fig. 11a). Fortunately, the flight crew were able to glide the airplane to a safe landing. A similar incident occurred on December 15, 1989, when KLM Flight #867 flew through an ash cloud emanating from Alaska’s Mount Redoubt. The flight dropped 4,000 m in 8 minutes before the aircraft’s engines were able to be restarted and the plane safely landed. In April 2010, an ash plume from Iceland's Eyjafjallajökull volcano (Fig. 11b) reached a height of 5,500 m (18,000 ft) before high altitude winds dispersed it into a diffuse ash cloud over western Europe (Fig. 11c). Although this was not an especially large volume eruption, commercial air traffic was disrupted throughout Europe for several weeks.
Volcanic Ash And HealthThe fertile soil that volcanic ash and rock produce is good for farming, but living downwind from an active volcano carries a significant health risk. Volcanic ash is rich in minerals and produces very high quality soil, which encourages agricultural activity even right onto the slopes of active volcanoes. If there is a pyroclastic flow, fatal burns and asphyxiation are inevitable. But even cooled ash falls carry health risks to both humans and livestock. Chile’s Puyehue-Cordón Caulle volcano produced an ash plume in 2011 that lasted for 9 months and circled the southern hemisphere. Ash fall extended as far as Buenos Aires, Argentina (Fig. 12a). In addition to disrupting air traffic, the ash killed hundreds of thousands of sheep, goats and cattle in Chile and Argentina from a combination of starvation and ingestion of toxic amounts of fluoride. Angular ash particles can affect human respiratory systems if inhaled for more than a few days. Face masks are advised for those who have to clear away volcanic ash from their homes (Fig. 12b).
LaharsRivers of tephra and water slurry, called lahars, are a danger to those who live near volcanoes. Stratovolcanoes with snowcaps, crater lakes, or in areas of heavy rains, are especially dangerous during an eruption. The water mixes with tephra to form a mud- and rock-rich slurry, called a lahar, that forms a fast-moving flow of debris down the volcano’s flanks and down-valley (Fig. 13a). Although lahars most often occur during an eruption, heavy rain can trigger them at any time. The eruption of Nevada del Ruiz in Colombia, in 1985, created one of the worst lahar disasters of recent decades. Lahars flowed for over 100 km down the valley of Río Lagunillas, engulfing the town of Armero in up to 5 m of volcanic mud and rock (Fig. 13b). More than 23,000 people were killed and more than 5,000 homes were destroyed. For those who live in valleys that radiate from active volcanoes, the risk of a lahar may be mitigated to some extent by levees, although these may be overrun by extremely large lahar flows.
Vesuvius and PompeiiItaly’s Mount Vesuvius buried the Roman cities of Pompeii and Herculaneum in ash and pyroclastic deposits in A.D. 79. Vesuvius is a typical stratovolcano (Fig. 14a) located near today’s city of Naples, Italy (Fig. 14b). Moderate earthquakes are frequent in the region and one in A.D. 62 had already damaged the Roman cities of Pompeii and Herculaneum before Vesuvius explosively erupted on August 24, A.D. 79, sending a plume and cloud of ash and gas at least 30 km into the atmosphere. Pumice fell onto Pompeii during the first of several pyroclastic flows to engulf the city and regions south of the volcano in deposits almost 3 m thick. At least 1,500 citizens were buried beneath thick pumice and ash (Fig. V14b). A lahar buried the city of Herculaneum the next day. The explosive eruption and its sustained plume of ash was chronicled by Pliny the Younger. Similarly violent stratovolcano eruptions are therefore sometimes referred to as Plinian eruptions.
Craters And CalderasMost volcanic eruptions leave behind craters. Mega-craters, called calderas, form when a volcano collapses into its own magma chamber. Volcanic craters (Fig. 15a) form when rock around the eruptive vent is blasted away during an eruption. Calderas are mega-craters, tens of km or more in diameter, that form where the roof of the magma chamber becomes so fractured and unstable that most or even all of the volcano collapses into the partly emptied magma chamber below (Fig. 15b). The sudden reduction of pressure on the magma chamber results an explosive, catastrophic release of gases from the magma, with ejection of massive amounts of ash, pumice, and tephra (Fig. V15c), including the fragmented volcano’s original rock and ash layers. After a caldera collapse, the magma beneath is depleted in gas. As the caldera’s surface gradually cools and solidifies, the extremely sticky, gas-poor magma often resurges in lava domes that help to thicken the roof of the magma chamber.
Crater Lake HazardsLakes that form inside craters and calderas are beautiful, but may also pose a significant hazard. Many tourists visit crater lakes to enjoy their clear waters and symmetrical form (Fig. 16a). However, in a volcanically active region, these lakes are a water source that can mix with ejected tephra to form deadly lahars, or form an explosive mix with lava in any subsequent eruptions. Lake Toya is a large caldera lake in northern Japan (Fig. 16b) that has central resurgent domes, hot springs around its margin, remains ice-free in winter despite its northern latitude, and is promoted as a spa resort. Mt. Usu, an active stratovolcano on the edge of the 110,000 year-old caldera, has erupted on a 30 to 50 year cycle, most recently in 1977 and 2000. On the flank of Mt. Usu, a new 400 m-high lava-dome (Fig. 16c), pushed up unexpectedly through wheat fields after a series of strong earthquakes in 1944 and 1945. The volcano is closely watched by the residents of the nearby resort city of Date, which has a population of about 40,000.
FumarolesMost of the vapor emitted from fumaroles is superheated steam, but toxic gases are also emitted and condense into acidic pools and lakes. Volcanic gases escape to surface through cracks and fissures known as fumaroles (Fig. 17a). Water vapor (steam), carbon dioxide, and sulfur dioxide at temperatures of over 400oC are the most abundant fumarole emissions. These are usually localized emissions that are relatively harmless, although they can appear without warning above active and even dormant volcanoes. The superheated gas can disperse quickly into the atmosphere, where it creates acid rain, or erupt as a hot water and gas mixture in a geyser (Fig. V17), or condense into deceptively clear, but hot and acidic pools (Fig. 17c). Other common and hot gas emissions include carbon monoxide, hydrogen sulfide, hydrogen fluoride, and hydrogen chloride, all of which are toxic and cause serious respiratory problems that can be lethal for humans and for livestock.
Catastrophic Gas EmissionCarbon dioxide from Cameroon’s Oku volcanoes accumulated under Lake Nyos before suddenly asphyxiating villagers and their livestock. A devastating burst of volcanic gas occurred on August 21, 1986, when more than 1,700 people and 3,500 livestock living near Lake Nyos, Cameroon, were found asphyxiated. Clues to the deaths, which occurred overnight without any property or vegetation damage, were found in the lake itself. Instead of its normal clear water, the lake looked as though it had been vigorously stirred (Fig. 18a). Carbon dioxide (CO2) from the underlying Oku volcanic field (Fig. 18b) had been building up in the lake bottom sediments. It is thought that a small landslide into the lake caused CO2 bubbles to suddenly rush to surface, just like the famous diet cola and candy experiments (Fig. 18c). The dense CO2 gas stayed close to the ground during the cool night, asphyxiating those living around the lake shores. In the morning, warmed by the Sun, the gas dispersed by convection, leaving no trace.
Mitigating Volcanic GasesDangerous carbon dioxide build-up in lake bottom sediments can be prevented by controlling the gas, allowing it to escape gradually to surface. Where soluble volcanic gases, such as CO2, bubble through water on their way to surface, some of the gas goes into solution, acidifying the water. Under the high pressure of deep water, such as at the bottom of a lake, CO2 can build to high concentrations. To mitigate against another catastrophic build-up of lethal gas from Lake Nyos, such as occurred in 1986 (and also to a lesser degree in 1984), a control system now releases the CO2 gas in a steady, harmless stream (Fig. V19a). Lake Monoun, also in Cameroon, and Lake Kivu in East Africa have similar problems of CO2 gas accumulation (Fig. 19b). Goma City, on Lake Kivu, was partially destroyed in 2002 when Mt. Nyiragongo erupted. Goma City’s volcano observatory now monitors the condition of Lake Kivu and Nyiragongo.
KrakatoaThe volcanic island of Krakatoa, Indonesia, exploded on August 27, 1883, causing a tsunami that killed nearly 36,000 people. Krakatoa (also called Krakatau) is one of many active stratovolcanoes in the Sunda Strait, between Java and Sumatra, Indonesia. In the 1800’s, Krakatoa was an uninhabited island in the middle of an existing 7 km-wide caldera (Fig. V20a). On August 27, 1883, the volcanic island erupted in four explosions that blew away two thirds of the island (Fig. V20b) and were heard almost 5,000 km away. Over 36,000 people were killed by the resulting tsunami. Pyroclastic flows travelled for 40 km across the surface of the Sunda Strait to the coast of Sumatra. The ash plume reached an estimated height of 80 km (Fig. 20b) and over the next year, global temperatures fell by 1.2°C. In 1927, a new volcano called Anak Krakatau (“Child of Krakatau”) appeared in the center of the caldera. The active volcano (Fig. 20b) continues to grow at an average rate of 13 cm per week.
Yellowstone’s SupervolcanoA supervolcano is a volcano that produces more than 1,000 km3 of volcanic deposits in a single eruption. Yellowstone has done so, twice, along with many smaller, yet still significant, eruptions. The Yellowstone volcanic field has had a long history, starting over 16 million years ago (16 my) when the North American Plate began moving over a mantle hot spot (Fig. 21a). At 2.1 my, a single eruption produced over 2,450 km3 of ash deposits, some of which drifted well to the east of the Rocky Mountains (Fig. 21b). Another eruption at 0.64 my created the present day Yellowstone Caldera and produced over 1,000 km3 of tephra in a single eruptive event, which is now used as the definition of a ‘supervolcano’. The only larger eruption in the past 2 million years is that of Toba, Indonesia, at 0.74 my. (Fig. 21b). Yellowstone’s last eruption – mostly lava flows and a little tephra – occurred 70,000 years ago. The hot spot is now beneath the thick crust of the Rocky Mountains and therefore another cataclysmic eruption is considered very unlikely.
Supervolcano TobaToba erupted 74,000 years ago in a cataclysmic explosion, spewing a cloud of ash and gas that caused temporary global cooling. The biggest explosive volcanic event of the last 2 million years occurred on Sumatra, in Indonesia. Two major eruptions occurred in the region at 840,000 and 700,000 years ago, and others have occurred at roughly 400-year intervals, but these were dwarfed 74,000 years ago when one or more of Toba’s volcanoes collapsed to form a huge caldera (Fig. 22a). More than 700 million tons (2,800 km3) of ash and pyroclastic material were ejected in this supervolcano eruption. Toba’s catastrophic eruption created a plume of ash and sulfur dioxide gas that was carried by prevailing winds into a cloud that blocked sunlight over the northern hemisphere for a decade, causing at least a 3oC drop in global average temperatures. Ash fall from the eruption has been traced over much of India (Fig. 22b) and can even be detected in ice cores from Greenland. Evidence from mitochondrial DNA suggests that the combined effect of the explosion, tsunamis, and ash fall was enough to greatly reduce genetic diversity in homo sapiens at the time.
Volcanoes And Mass ExtinctionsOutpourings of lava and tephra on an enormous scale have occurred in the geological past and may have contributed to the mass extinction of species. An enormous outpouring of basaltic lava occurred 66 million years ago (66 Ma), near present day Mumbai, India. In less than 30,000 years, lava flows covered almost 1.5 million km2. About 200,000 km2 still remains as a 2,000 m-thick pile of basaltic rock known as the Deccan Traps (Fig. V3a). Global cooling caused by sulfur dioxide gas and ash from the eruptions may have contributed to the extinction of non-avian dinosaurs. At least two other enormous eruptions of basaltic lava are known to have occurred at the same time as mass extinctions of species. At 250 Ma in Siberia, and at 200 Ma in the proto-Atlantic Ocean basin, outpourings of lava occurred as supercontinent Pangea began to break apart, although direct links with the extinctions are yet to be confirmed. These massive eruptions are thought to have originated where magma above hot mantle plumes had become pooled beneath thick continental crust (Fig. 23b).
Mt. St. Helens, Cascade RangeThe 1980 eruption of Mt. St Helens in the Cascades Range of western North America unexpectedly blew away one side of the mountain. Volcanoes in the Cascade Range sit above the subduction zone between the Juan de Fuca Plate and the North American Plate (Fig. 24a). In early spring of 1980, seismic activity increased beneath Mount St. Helens and the north side of the volcano started to bulge outward. On May 18, 1980, the mountainside above the bulge unexpectedly blew apart and collapsed in an avalanche of debris. The sudden reduction of pressure on the magma inside the volcano produced an explosive lateral eruption, with a pyroclastic flow that travelled as far as Spirit Lake (Fig. 24b) and a 24 km-high ash column Lahars raced down each of the valleys that radiate from the volcano. Although a mandatory evacuation order had been issued for the region around the volcano on April 30, several individuals had been allowed back into the area on May 17 to collect belongings. In total, fifty-seven people were killed, mostly by asphyxiation, including a geologist who had been monitoring the volcano. Mount St. Helens was again active, on a smaller scale, in 2004–2008.
Iceland: Where A Hot Spot and Mid-Ocean Ridge CoincideIceland sits astride the Mid-Atlantic Ridge where it intersects with a mantle plume, resulting in frequent volcanic activity. The basaltic shield volcanoes along mid-ocean ridges have low-elevation and usually remain well below sea level. One notable exception is Iceland, on the Reykjanes Ridge section of the Mid-Atlantic Ridge. Gravity data obtained via satellite shows abnormally elevated ocean crust around Iceland (Fig. 25a), indicating that the ridge coincides with a mantle hot spot thermal anomaly. Iceland is composed entirely of basaltic rock from at least 130 volcanoes, of which 18 have been active in the past 1,000 years. Recent eruptions have been mainly in the south, along a new branch of the spreading ridge (Fig. 25b). In 1963–1969, offshore eruptions resulted in the formation of the new island of Surtsey. Heckla, which last erupted in 2000, and Eyjafjallajökull which erupted in 2010, are two of the most active volcanoes on the island.
Iceland’s Dry Fog Of 1783Toxic gases from the Laki eruption of 1783-84 caused a widespread dry fog that reduced sunlight, produced acid rain, and damaged crops. Beginning in May 1783, lava eruptions from the Laki Fissure on the Reykjanes Ridge, southern Iceland (Fig. 26a), destroyed several farms and villages. However, the most devastating effect of the eruption was a release of toxic gases in the form of a dry fog that blanketed Iceland and extended to much of the northern hemisphere in the summer of 1783 (Fig. 26b). Solar energy in the fog-covered regions was greatly reduced, making the winter of 1783-4 the coldest in 250 years. Unlike a water-based fog, the ash- and sulfur-rich haze did not evaporate in sunlight. Acid rain and poisonous fumes severely damaged Icelandic grasslands and crops, decreased the Icelandic fish catch, and caused 50% of Iceland’s livestock to die within the year. Thousands of Icelanders died as a result of famine and respiratory problems, reducing the population of the island by 25%.
Trying To Stop A Lava FlowDrenching a lava flow with cold water may slow it down, although it is unlikely to stop it altogether. Iceland’s volcanoes have erupted many times since the island was settled and the islanders have learned to mitigate some of the damage they cause. In January 1973, Eldfell volcano erupted close to the fishing port of Vestmannaeyjar, in southern Iceland (Fig. 27a). Fishing vessels were used to evacuate most of the port’s citizens. The Icelanders erected protective barriers, but still a total of 400 buildings were destroyed by lava flows and tephra falls. As lava encroached on the harbor’s entrance, an attempt was made to freeze the molten rock by drenching it with millions of cubic meters of seawater (Fig. 27b). This approach was not entirely successful in stopping the flow, but may have helped to save some properties (Fig. 27c). After a few months, Eldfell’s eruptive activity ceased. The damaged parts of the town were eventually rebuilt and heat from the cooling lava was used to construct a district heating system.
Volcanic Hazard MapsHistorical records of past eruptions are used to create hazard maps, which indicate the likelihood and type of a future event in a particular location. Understanding the risks from an active volcano depends to a large extent on knowing its past behavior. An example is Mount Rainier (Fig. 28a), an active volcano in the Cascade Range near the city of Tacoma, U.S.A. It has erupted four times in the past 11,000 years, the most significant event being 2,200 years ago, and is being closely monitored for any signs of renewed activity. A volcanic hazard map (Fig. 28b) has been constructed for areas surrounding Mount Rainier, based on past lava and pyroclastic flows, lahars, and present day geography. The map shows the most vulnerable areas in the valleys that radiate from the volcano. Volcanic hazard maps are not, however, foolproof. Nearby Mount St. Helen’s lateral blast in 1980 was unpredicted. The resulting landslide and volcanic debris covered an area 15 times greater than shown on its hazard map.
Measuring ExplosivityThe Volcanic Explosivity Index (VEI) expresses the violence of historic volcanic eruptions on a logarithmic scale. In 1982, researchers from the US Geological Survey and the University of Hawaii developed the Volcanic Explosivity Index (VEI) as a tool for use in assessing the likelihood of future violent eruptions from the world’s active volcanoes. The VEI expresses the relative violence of historic volcanic eruptions on a logarithmic scale of 0 to 8 (Fig. 29a). Assignment of a VEI of 0 means that eruptions are non-explosive, have a low volume of ejecta, a low (or no) ash plume height, and occur frequently. The basaltic shield volcanoes of Hawaiian Islands, such as Kilauea, are typically VEI 0. An eruption of VEI 8 is what we now call a supervolcano, a rare event with over 1,000 km3 of ejecta and an ash plume height of over 25 km, such as Yellowstone and Toba. For comparison, the Mount St. Helens eruption of 1980 was VEI 5, Krakatoa (1883) and Pinatubo (1991) eruptions were each VEI 6, and Tambora (Fig. 29b) in 1815 was a VEI 7.
Eruption RecurrenceThe average time between eruptions is the eruption recurrence interval – an indicator, but not an accurate predictor, of future events. Anyone who lives near an active volcano (and their insurance companies) would like to know when the next eruption will occur. A measure often used is the Average Recurrence Interval (ARI), which is the average frequency of eruptions. To calculate ARI, it is necessary to know the number, n, of eruptions that occurred in time period N, which can range from years to tens of thousands of years (Fig. 30a). To estimate ’n’ often requires detailed geological research as well as data from historical records where these are available. Unfortunately, ARI is not very useful for small data sets (Fig. 30b) and says nothing about the possible magnitude of the event. Furthermore, even the best-behaved volcanoes can be unpredictable if the composition of the magma changes, or if new fractures or feeder pipes open to the surface such as after an earthquake.
Monitoring Active VolcanoesAll active volcanoes around the world are now monitored for signs of an imminent eruption. As magma moves around inside a volcano, it fractures the surrounding rock, creating numerous micro-earthquakes. A significant increase in local seismic activity is therefore one indication than an eruption is likely. An increase in the quantity of gas emitted or a change in gas composition may indicate that magma is degassing its approach to surface. Changes in the volcano’s shape, such as steepening slopes or development of an unusual bulge on one flank, can also indicate that an eruption may be imminent (Fig. 31a). Although the timing of an eruption cannot be predicted with absolute certainty, most active volcanoes exhibit one or more of these precursor activities. There are now several international and national programs to monitor active and potentially active volcanos (Fig. 31b), and provide timely warnings to the public on the need to evacuate or take other precautionary action.
Mitigation Of Volcanic Hazards By EvacuationSuccessful mitigation of the effects of an eruption requires a well-executed preparedness plan and a willingness of the population to evacuate. Two examples show how effective a full-scale evacuation can be in mitigating the effects of a volcanic eruption. In March 2000, Mt. Usu volcano in Japan (Fig. 32a) erupted after an interval of 23 years. An increase in earthquake activity near the volcano in the previous few days had triggered the evacuation of over 16,000 residents and tourists – the result of well-organized preparedness planning. Mt. Usu erupted 36 hours after the evacuation, causing no injuries or loss of life. In September 2014, the Philippine Institute of Volcanology and Seismology, which monitors the activity of all 25 active volcanoes in the Philippines (Fig. 32b) observed increased seismic activity and rockfalls at the Mt. Mayon stratovolcano and issued an evacuation advisory. More than 12,000 people were evacuated from areas near the volcano prior to Mt. Mayon’s eruption, which was relatively minor. Unfortunately, volcanoes seldom behave exactly as predicted and citizens may resist future evacuations if a previously predicted eruption did not occur or was small in scale.
Promoting ResilienceResilience is defined as the ability to adapt to adverse circumstances. Providing information about volcanic risks does not mean precautionary measures will always be adopted. In a study published in 2000, researchers in New Zealand showed that 92% of city residents in Auckland were very aware of the likelihood of volcanic ash fall from nearby active volcanoes, however only 10% had stored food and water, 9% had a first aid kit, and 7% had an emergency radio. The study suggests that even where the hazards of living adjacent to active volcanoes are well communicated and understood, people may overestimate their own capability for resilience and may also assume that the authorities will take responsibility for everyone’s safety. Wide-scale community cooperation and trust are necessary to ensure adequate resilience to the rare, but potentially catastrophic, violent volcanic eruptions of the future. Figure 33 shows the frequency of eruptions greater than a VEI of 4 over the past 2 million years – roughly since the time that early humans began to spread round the globe. Although the VEI map in Figure V33 does not take into account the destruction from lahars or the effect of large volume gas emissions, the overview provides an indication of the potential volcanic risks for which populations in various parts of the world need to be prepared.
Class Reading ListPlag, H.-P., Brocklebank, S., Brosnan, D., Campus, P., Cloetingh, S., Jules-Plag, S., Stein, S., 2015. Extreme Geohazards — Reducing the Disaster Risk and Increasing Resilience. European Science Foundation. pdf. Oppenheimer, C., 2003. Climatic, environmental and human consequences of the largest known historic eruption: Tambora volcano (Indonesia) 1815. Progress in Physical Geography, 27(2), 230-259. Doi: https://doi.org/10.1191/0309133303pp379ra. Decker, B. B., Decker, R. W., et al., 2017. Volcano. Encyclopaedia Britannia, html. Miles, G. M., Grainger, R. G., Highwood, E. J., 2003. Volcanic Aerosols: The significance of volcanic eruption strength and frequency for climate. Q. J. R. Meteorol. Soc., 128, doi: 10.1256/qj, pdf. Back to ContentsMidterm preparation and Develop Case Study 2 (Geohazards)Midterm exam preparationIn the midterm, all questions will relate to three specific hazardous events. Specific examples of an extraterrestrial hazard, an earthquake, and a volcanic eruption will be discussed. The events are :
The Midterm exam will ask questions related to the hazards, the resulting disasters and the processes that determined the extent of the disasters. Questions in the Midterm exam will relate to:
The Lab slides provide some details on the hazards, and the reading list below provides material to study. Study Case 2The second study case will focus on a geohazard of your choice, that occurred in the past. Geohazards include earthquakes, tsunamis, landslides, volcanic eruptions, ground instabilities, and sink holes. Details on the study case requirements and format are available here and also on the Lab slides. Lab Reading ListExtraterrestrial HazardsWikipedia, 2018. Solar Storm of 1859. html Phillips, T., 2014. Near Miss: The Solar Superstorm of July 2012. NASA. html. Lovett, R. A., 2011. What If the Biggest Solar Storm on Record Happened Today? National Geographic News, html. Lloyd's, 2013. Solar storm Risk to the north American electric grid. Technical Report produced by Lloyd’s. pdf or pdf. EarthquakesRafferty, J. P., 2016. Nepal earthquake of 2015. Encyclopaedia Britannica, html. Wikipedia, 2017. April 2015 Nepal Earthquake. html Wikipedia, 2017. May 2015 Nepal Earthquake. html Wyss, M., 2005. Human losses expected in Himalayan earthquakes. Nat. Hazards, 34, 305-314. Wyss, M., 2017. Four loss estimates for the Gorkha M7.8 earthquake, 25 April 2015, before and after it occurred. Natural Hazards, Special Issue, doi:10.1007/s11069-016-2648-7. Volcanic EruptionsWikipedia, 2017. 2010 eruptions of Eyjafjallajökull. html. Wikipedia, 2017. Air travel disruption after the 2010 Eyjafjallajökull eruption. html. Wikipedia, 2017. Volcanic ash and aviation safety. html Loughlin, S., n.d. Eyjafjallajökull eruption, Iceland | April/May 2010. British Geological Survey. html. Sears, T. M.; Thomas, G. E.; Carboni, E.; Smith, A. J. A.; Grainger, R. G. (2013). "SO2 as a possible proxy for volcanic ash in aviation hazard avoidance". Journal of Geophysical Research: Atmospheres. 18: 1–12. doi:10.1002/jgrd.50505 Shindell, D, 2009. NASA GISS: Science Briefs: Super-Eruptions, Climate and Human Survival. html, doi:10.1029/2008JD011652. Class 7: Landslides and Ground InstabilitiesLandslidesLandslides are large volumes of loose rock and/or soild that move downslope, more or less as one mass, under the force of gravity. The general term landslides is used for a wide range of downslop movements of rock and soil. The general term ‘landslide’ is used for a wide variety of downslope mass movements of rock or earth along with any associated vegetation (Fig. L1a). . They can occur on steep slopes anywhere, but are most frequent in mountainous regions, along steep river banks, coastal cliffs, and in regions of active tectonic uplift, such as on convergent plate boundaries, especially where earthquakes and/or heavy rains are common. Landslides are responsible for thousands of deaths and injuries, and billions of dollars in property damage worldwide each year. A study published in 2012 documented more than 32,300 fatalities caused by landslides in the 7-year period between 2004 and 2010, with the majority of deaths occurring in the Himalayan mountains and earthquake-prone regions of China (Fig. L1b).
Landslide TerminologyLandslide terminology has parallels with human anatomy, with a crown, head, body, foot, and toe. Regardless of the size of a landslide, the basic morphology is similar in all cases (Fig. L2a). The loosened material slumps or slides downhill on a basal rupture surface that separates the landslide from intact material below. The rupture surface can be curved, as in a rotational slump or slide (so called because the sliding blocks rotate about a horizontal axis as they move downhill), or planar, as in a translational slide (no block rotation). A bare scarp surface is left between the ‘crown’, above the landslide, and the topmost surface of the slide, which is called the ‘head’(Fig. L2b). often there are numerous minor scarps and transverse cracks, some of which can develop into scarps, in the ‘body’ of the landslide. Much of the devastation from large landslides occurs at the ‘foot’ and ‘toe’ of the slide (Fig. L2b), which can run out for significant distances down-valley and spread out into lobes across-valley.
Landslide TypesLandslides are classified on the type of movement that occurs and the type of material involved. The classification of landslides is based principally on the type of movement that occurs (Fig. L3a). All are the result of gravity acting on the rock or earth, aided by water, and/or vibrations such as earthquakes or repeated pounding of storm waves on cliff faces, and all require moderate to steep slopes. Most of the landslides that cause major destruction to people and property are either slides or flows, or have some combination of these two movement types. Rotational debris and earth slides (Fig. L3b), also known as slumps, are among the most common and they can also be the most deadly (Fig. L3c). These slides frequently become debris or earth flows that can travel significant distances as the loose material moves rapidly downhill, entrapping air and water so that the foot and toe of the slide behaves as a fluid.
Cohesive StrengthThe cohesive strength of a material, whether rock, loose sand, or dirt, is its ability to hold together. Porous rocks like sandstone have a lower cohesive strength than hard rocks like granite and basalt. A rock’s minerals and grains bind together to give the rock its cohesive strength, in other words its ability to hold its internal constituents together. Some rocks, such as granite and basalt, have a very high cohesive strength. They can form stable vertical cliffs and overhangs (Fig. L4a), which rockclimbers enjoy. Blocks of rock that fall from the cliff form a mound of talus, also called scree, at the cliff’s base. Other rock types, particularly sedimentary rocks such as sandstones and limestones, are more porous, with rather low connectivity between grains, and therefore they have a lower cohesive strength than granite. Although many of these rocks are also able to form steep cliffs (Fig. L4b), they are much less stable than granite cliffs and loose blocks are prone to fall: rock-climbers generally avoid climbing on them.
Rock Falls And TopplesRock falls are the sudden detachment and free fall of blocks of rock from very steep slopes and cliffs. Topples are falls that pivot outward before falling. Rocks lose much of their cohesive strength when they are fractured. The more fractures in the rock, the more likely will blocks fall from steep, rocky slopes and cliffs. Water or ice opens up preexisting cracks and separation planes in the rock, loosening the blocks which then detach from the cliff face either by dropping straight downward (rock fall, Fig. 5a) or by pivoting outward before falling (rock topple, Fig. 5b). In mountains that receive winter snows, fractures often open up during the spring thaw season, making this an especially dangerous time of year for rock falls. Rock falls occur suddenly, especially in or shortly after heavy downpours of rain, or in earthquakes when the shaking motion further loosens blocks, and they can be highly inconvenient when they disrupt traffic (e.g., Fig. L5a), although they seldom have more than a local effect.
Rock Slides And Slope AngleFrictional resistance to sliding is lower for steep slopes than for gentle slopes, therefore a main rock slide trigger is slope steepening. Landslides can be triggered by any action that reduces the frictional and cohesive forces holding material in place on a hill slope. Gravity acting on a sloping surface has two components: one that pulls perpendicular to the slope, providing frictional resistance to downhill movement, and one parallel to the slope of the surface, which drives the downhill motion (Fig. L6a). Frictional resistance to sliding of a rock mass is greatly reduced on steep slopes and by water on the slope’s surface beneath the mass. All hill slopes, regardless of size, have a natural angle of stability, called the angle of repose, that varies with the material. If the slope is steepened beyond its angle of repose by tectonic or volcanic uplift, or by removal of material at its base (Fig. L6b), slumping of material from above will likely occur to restore stability (Fig. L6c).
Rock Slides On Weak ZonesRock slides can occur on quite moderate slopes, if aided by water or weak zones within the rock. Many rocks contain natural zones of weakness within them, such as original layering when the rock’s constituent grains were deposited in sedimentary strata, known as beds, under water. Thin, clay-rich beds and layers that are rich in very weak minerals, such as gypsum, have lower strength than thick, sandy beds. Weak zones in rock also occur as a result of tectonic movements. Blocks of rocks are especially liable to slide on these weak surfaces where the strata are tilted (Fig. L7a) and when the weak zones are further lubricated by water (Fig. L7b). On September 19, 1889, a rock slide from the Cap Diamant cliff in Québec City, Canada, killed more than 40 people (Fig. L7c). The slide occurred in a location that had seen three previous fatal rock slides, but houses situated across the road from the cliff had been considered safe even after the earlier slides – until the 1889 slide proved otherwise.
Mitigation Of Small Scale Rockslides With Rock BoltsRockslides on a small scale can be partly mitigated by rock bolts with or without wire netting. A rock bolt is an anchoring screw that is used to secure potentially loose slabs of rock to more intact rock (Fig. L8a). Rock bolts are very commonly used to secure tunnel roofs in mines and in road and rail cuts (Fig. L8b). To be effective, they must be arranged in closely spaced groups with the pattern determined by the type of rock and the size and shape of the loose slabs. On a larger scale, rock slopes can be party stabilized with wire safety netting (Fig .L8c). This type of mitigation is commonly used in road and railway cuttings where the loose rock slabs are relatively small. As blocks are dislodged by rain or vibrations, they collect at the bottom of the netting where they can be periodically cleared away as necessary. This approach is really only successful on a small scale, with rock that has relatively few weak zones beneath the exposed slope surface.
Debris FlowsDebris flows and debris avalanches are each a type of fast-moving, wet landslide in which over 50% of blocks in the flow are at least pebble-sized. A debris flow is a wet mixture of rocks and earth, known as a slurry, that moves suddenly and rapidly downslope, usually within steep, narrow gullies (Fig. L9a). Debris flows need a large amount of loose material (e.g., Fig. L9b), and are more likely to occur where there is little vegetation because the presence of tree roots helps to anchor loose soil and small rocks. When the loose material becomes saturated with rain or snowmelt, or shaken such as by an earthquake or a volcanic eruption, it loses cohesion and gravity moves the mass rapidly downhill. The distinctions among debris flows, debris avalanches, and mud flows are based on the predominant particle size in the landslide, as this governs the landslide’s overall behavior. Debris flows contain mostly large blocks, at least 50% pebble-sized (between 10 and 60 mm diameter on average) and often much larger.
Leyte, Philippines, 2006A debris avalanche in 2006 caused over 1,100 fatalities on Leyte Island, central Philippines. At 10:30 a.m. on February 17, 2006, a complex rockslide/debris avalanche occurred on Leyte Island in the mountainous region of the Central Philippines (Fig. L10a). The 450 m-high hill behind Guinsaugon village consisted of fractured and sheared volcanic and sedimentary rocks along a major tectonic fault zone. About 4 days after a long period of heavy rain, during a particularly intense La Niña season, 15 million cubic meters of the hillside slid rapidly downhill. The debris flow completely engulfed Guinsaugon (Fig. L10b), causing over 1,100 fatalities, including 245 children who were in school. The foot of the rockslide/debris flow ran out by almost 4,000 m on a slope angle of about 12o. It is thought that when the debris flow reached flooded paddy fields in the valley, the additional water from the fields was incorporated into its base, enhancing its ability to flow and spread rapidly.
Landslides In Sands And ClaysDry sands have low cohesive strength and cannot build cliffs. Clays have more strength, but both materials will flow when saturated with water. Rocks become weathered by water and wind into sands and clays, which have a cohesive strength, but not as much as the original unweathered rock. Clay minerals have a flat, tabular shape and can better stick together than rounded sand grains. Frictional resistance to movement gives each of these loose materials additional strength when they are dry (Fig. L11a), but friction is easily overcome by gravity on very steep slopes. A small amount of water seepage into the spaces between grains creates a thin film of water around the grains. The surface tension of the water film increases the overall cohesive strength of the material (Fig. L11b). However, too much water pushes grains apart and drastically reduces the overall strength (Fig. L11c). The more water the material has in its spaces, the lower its strength. With enough water, or when vibrated, such as by an earthquake, gravity will completely overcome the combined cohesive and frictional strengths of loose materials, and a landslide results.
MudflowsMudflows contain more than 50% sand-sized or smaller particles. They can set like concrete. Like debris flows, a mud flow (also known as an earth flow) moves very rapidly down hill as a single, flowing mass (Fig. L12a), and the terms are often used interchangeably in the media. The main difference among the different types of flow is that the predominant particles in a mud flow are sandsized or finer (2 mm or less), and the material spreads out into a broad zone, even on very low slope angles, at the foot of the slide. Mudflows can move at speeds up to 50 km per hour. The smaller the particles in the flow and the more water it contains, the farther and faster it will travel. Where several mudflows are generated at the same time, such as by an earthquake, they can coalesce downstream into one very large flow that can completely overwhelm towns and villages. However, as soon as the mudflow stops, the material sets like concrete (Fig. L12b), making rescue efforts extremely difficult.
Saturated Soils: Landslides In Brazil, 2010Exceptionally heavy rain caused dozens of landslides near Rio De Janeiro, Brazil, in 2010. In the early months of 2010, heavy rain soaked the hillsides in Morro da Carioca, near Rio de Janeiro, Brazil, resulting in more than 80 landslides. More than 4,000 families were made homeless by the landslides in 2010, and at least another 10,000 houses were considered at risk. There were at least 60 fatalities in January of that year, including in the city of Angra dos Reis (Fig. L13a), where homes had been built directly onto very steep slopes. At least 12 people lost their lives. Also, on the nearby resort island of Ilha Grande, at least 26 people died in a landslide from the same storms. By April of 2010, the region had seen the heaviest rains in nearly 50 years, and on April 6 a landslide in the town of Niteroi resulted in 196 fatalities and the loss of 50 homes (Fig. L13b). The slide swept up part of a garbage landfill in its path, which made rescue efforts particularly challenging.
Monsoons And Debris FlowsNorthern India is vulnerable to landslides in the monsoon season, or at any time of intense rainfall. Villages in steep-sided valleys are at the most risk. Landslides are a regular occurrence during the monsoon season in the mountains of northern India. On July 30, 2014, in the state of Maharashtra, 151 people died in one landslide after torrential rain. In years when monsoons rains are heavier and last longer than usual, such as in 2010, there can be dozens of landslides. In that year, over 320 people in northern India — many of them children — were killed in more than 80 separate landslides. A multi-day downpour in June 2013, in the state of Uttarakhand, caused intense flooding and landslides, including a debris flow that completely destroyed the Hindu shrine village of Kedarnath (Figs. L14a and b). The village was located in a valley south of Mt. Kedarnath, beneath large glaciers (Fig. L14c), and one explanation for the disaster is that part of a glacier may have collapsed in the rain, triggering a downstream debris flow.
Zhouqu, China, August 2010The largest landslide of 2010 in terms of fatalities was the Zhouqu mudflow in Gansu, China on 8th August, which killed 1,765 people. One of the most devastating landslides in recent history occurred in the mountainous region of central China on August 8, 2010, when 1,765 people were listed as either dead or missing and thousands of homes were destroyed as a mudflow swept through the town of Zhouqu (Fig. L15a). The region had seen as many as 10 major landslides since the early 1800’s, and according to a 2006 report the landslide risks for the area had increased in recent years due to deforestation and mining activities. A previous landslide had recently dammed a stream, creating a temporary lake above Zhouqu town. Intense monsoon rains caused the lake level to rise until it broke through its natural dam wall, creating a slurry of mud as it raced through the town toward the Bailong River. Engineers had to blast away the debris in the river to avoid further flooding (Fig. L15b).
Hurricanes And LaharsHeavy rain from hurricanes triggers frequent landslides in Central America, including lahars from the slopes of long extinct volcanoes. Many people in the volcanic highlands of Central America farm on the flanks of volcanoes. Longextinct volcanoes often have very rich and fertile soils. Unfortunately, heavy rains from the regular hurricanes that pass over the region cause debris flows and lahars, which are a special type of debris flow composed entirely of loose volcanic material. Hurricane Mitch, in October 1998, devastated large parts of central America, causing hundreds of landslides. The most deadly was a debris slide/ lahar from the slopes of Casita Volcano in Nicaragua (Fig. L16a), which killed more than 2,000 in under 3 minutes as it engulfed the towns of El Porvenir and Rolando Rodriguez (Fig. L16b). The towns had been built, unknowingly, on a prehistoric lahar pathway. Radiocarbon dating showed that the valley had seen at least 3 major lahars in the past 8,300 years.
Deforestation And MudflowsMudflows after Hurricane Stan in 2005 killed over 1,000 people in Guatemala. Deforestation may have allowed the mudflows to travel greater distances. On October 5, 2005, up to 500 villagers in Panabaj, Guatemala, were killed when Hurricane Stan triggered a debris/lahar/mudflow from nearby Volcano Atitlán that engulfed their village (Fig. L17a). Guatemala is very prone to landslides and was listed in a 2009 United Nations report as 4th in the world in terms of risk of death from landslides. Deforestation between 1990 and 2005 removed 17% of Guatemala’s forests, and large trees in the path of a mudflow can help to slow down the flow and restrict the spreading at the toe (Fig. L17b). Guatemala was the hardest hit by Hurricane Stan, with more than 1,000 fatalities from mudslides. The loose volcanic sands on the slopes of its volcanoes are interlayered with clay soils that prevent water percolation. In heavy rain, water collects above the buried clay layers, reducing the earth’s cohesion and frictional resistance to sliding.
Deforestation In Bududa District, UgandaSince 2007, when deforestation was enhanced, the coffee-producing region of Bududa, Uganda, has seen several deadly landslides after heavy rains. On March 1, 2010, heavy rain induced landslides that buried at least 360 people on the slopes of Mt. Elgon, a 4,321 m-high extinct volcano in the Bududa district of Uganda (Fig. L18a). Three villages were engulfed, the worst effected being Nametsi, where 85 homes were destroyed. Survivors were relocated, but they complained of inadequate shelter, food, and water in their new settlement and also insufficient land to restart their farms, and many chose to return to their landslide-prone homes. Another landslide in Bududa district swept through four villages on June 26, 2012, after two days of heavy rainfall (Fig. L18b). Although the number of fatalities was relatively modest, 15 houses were buried and 448 people remained in high risk areas. Again on August 10, 2013, after 3 days of heavy rainfall and hailstorms, multiple mudslides and floods engulfed 5 villages in Bududa district. This time more than 3,000 people were displaced. This mountainous region of Uganda, known for its fertile volcanic soil and coffee production, has seen enhanced deforestation since 2007. Tree roots help to stabilize the thick soil on steep slopes. Although several ancient scarp slopes are visible on the satellite image in Figure L18a, local authorities claim that landslide incidence has increased markedly since the deforestation rate escalated.
Coastal CaliforniaStrong storms such as El Niño events make coastal California vulnerable to landslides. Annual highway maintenance costs are over $20 million. Southern California is known for its dry climate, but as the saying goes: “when it rains, it pours.” In 2005, a strong El Niño season brought torrential rains to coastal California and caused numerous landslides. One of the most damaging was on January 10 at La Conchita (Fig. L19a), where the sandy cliffs collapsed in a rotational slump, killing 10 people, engulfing 13 homes, and damaging 23 others. The cliffs had slumped previously in March 1995, destroying 9 houses (Fig. L19b). The 2005 slump slid on a saturated base layer, remobilizing about 15% of relatively dry and stiff 1995 debris. Landslides along this stretch of California’s coast, which includes the Southern Pacific rail line as well as US Route 1, are a common occurrence. Annual highway maintenance costs alone average at least $20 million, and in the winter of 1979-1980 they were well over $1.1 billion.
Remobilized Landslides: Oso, Washington, U.S.A., March 22, 2014Ancient scarps on mountainsides often mean that the slope beneath remains unstable. Many landslides remobilize more than once. On March 22, 2014, the hillside opposite the small settlement of Steelhead Haven, near Oso, Washington, collapsed in a rotational slump (Fig. L20a). Forty three people died, 10 more were injured and damages ran to over $50 million. The landslide, now referred to as the Oso slide, remobilized debris from previous landslides that were known to have moved many times,most recently in 2006 (Fig. L20b). Geological mapping of the Stillaguamish River valley shows that most of its hillsides are composed of debris (Fig. L20c) from landslides that occurred over the past 6,000 years. The research also showed that large landslides like the Oso slide in 2014 may occur in this region as often as every 400 to 1,500 years, with smaller ones at least every couple of decades.
Slope Undercutting: Guatemala City, October 2015Undercutting of a steep hillside by a small river played a major role in a devastating debris fall and debris flow in Guatemala. Heavy rain over several days triggered a debris fall on October 1, 2015, in Santa Catarina Pinula, near Guatemala City. The saturated debris turned into a mudflow at the foot of the fall (Fig. L21a). The homes in the town were constructed at the base of a 100 m-high hill that was thought to be stable. However, the Pinula River, which runs through the valley, had gradually undercut the hill slope at its base (Fig. L21b), making the slope susceptible to collapse when saturated with rainwater. More than 280 residents died and at least 120 homes were destroyed by the debris and mudflow. The Guatemala National Disaster Reduction Commission (CONRED) said warnings were issued in 2009 and 2014, that the slope was potentially unstable due to river erosion at its base, but they were unfortunately ignored.
Rock/Ice AvalanchesIce avalanches commonly collect debris during the landslide, creating a complex and devastating rock/ice flow that can travel extremely quickly. Avalanches of snow and ice are frequent occurrences in snow-capped mountains and are a known danger for skiers and mountaineers. However, when the falling ice also takes with it a quantity of rock, the mixture becomes deadly and can travel at very high speed for long distances down valley, often collecting more debris and ice along the way (Fig. L22a). Even though the rock/ice mass starts as a dry mixture, it flows as fast and as far as a debris flow slurry. Friction among the falling ice and debris pieces, within and at the base of the flow, heat and melt the ice to create thin films of water around the blocks – in the same way as an ice skater travels over an ice rink. Between the flow and its base, friction is effectively reduced to zero. As more of the ice melts, the flow becomes a true slurry that can travel for tens of kilometers (Fig. L22b).
Nevados Huascarán, PeruTwo major rock/ice avalanches, in 1962 and in 1970, devastated towns in the mountains of Peru. The Andes are a chain of mostly volcanic mountains that formed as the result of the Nazca Oceanic Plate’s subduction beneath the South American Plate. People who live in Peru and Chile must cope with the many landslides that result from ground shaking during strong earthquakes. On May 31, 1970, ground shaking caused by a MW7.8 earthquake off the coast of Peru triggered a rock/ice avalanche from Nevados Huascarán, in Peru’s Cordillera Blanca. The landslide’s estimated volume was between 50 and 100 million m3. It swept down the valley at up to 280 km per hour, completely destroying the town of Yungay and causing over 18,000 fatalities (Fig. L23a). A similar rock/ice avalanche from Mt. Huascarán in January 1962, that began with the fall of a hanging glacier, had devastated towns in the same valley, causing more than 4,000 fatalities, mainly in the town of Ranrahirca (Fig. L23b).
Earthquake Triggers, NepalLandslides triggered by ground shaking were responsible for many of the fatalities from the Nepal earthquakes of 2015. Although an individual landslide is confined to a localized area, casualties on a large scale result where the population density is high and many landslides occur at the same time, as in the Nepal earthquakes of April and May, 2015 (Fig. L24a). The intense shaking from the MW7.8 and MW7.3 earthquakes caused thousands of landslides, which contributed to one third of the estimated total 3,300 to 8,000 fatalities. The landslides were concentrated along the southern side of the Himalayan mountains, which is also where the population density is highest (Fig. L24b). As well as triggering debris slides, the shaking opened new cracks at the surface, which allows water access to the loosely consolidated debris remaining on the steep slopes. The risk of landslides in the region is therefore expected to remain high for at least the following 4 to 5 years.
Liquefaction LandslidesSaturated sands and clay-rich soils can liquefy – that is, flow as a liquid – when vibrated by an earthquake or even by heavy machinery. Quicksand is notoriously treacherous. Ground that seemed to be perfectly firm for walking can suddenly turn into a liquid. The phenomenon is called liquefaction. A fully saturated sand, with all the spaces between sand grains completely filled with water, can be quite stable if undisturbed. However, if shaken or disturbed, the grains settle into a more compact configuration, the water rises to the surface, and all cohesive strength is lost. Saturated ground often liquefies in earthquakes (Fig. L25a). Liquefaction landslides caused most of the destruction in Anchorage, Alaska, during a MW9.2 earthquake on March 28, 1964 (Fig. L25b). The city is built on clay- and sand-rich glacial sediments that are stable unless shaken, when they turn into quicksand. The liquefaction landslides destroyed 75 homes, a school, and parts of Anchorage’s main business district.
Liquefaction Of LoessThick loess deposits are found in many parts of the world. Although loess is very stable when dry, when saturated it liquefies extremely easily and flows great distances on very gentle slopes. A number of regions in the world, including large areas of western China, have thick deposits of loess – a wind-blown dust of very fine, angular particles that is strong and stable when dry, but very prone to liquefaction when saturated. In the normally arid Tien Shan mountains of Tajikistan, an earthquake of MW7.4 on July 10, 1949 in rainy weather triggered hundreds of landslides that included material from ancient loess deposits. In the Obi-Khaus-Dara River valley, several hundred people were killed when a combined rockslide/loess flow covered the town of Khait and Khisorak village (Fig. L26a). In the Yasman valley, several loess flows from tributary valleys coalesced into one huge flow, 10 m-thick (Fig. L26b), that travelled for 20 km on a slope of only 2° engulfing 20 villages Approximately 4,000 people were killed in Yasman valley.
Human-Induced LandslidesMany historic landslides have been triggered inadvertently by engineering activities. The consequences can be far-reaching. Humans have geo-engineered their surroundings since time immemorial. Many small and large landslides have been triggered by engineering projects such as dam-building, road and railway cuts, re-engineering of rivers, open-pit mining, and there major construction projects (Fig. L27a). One of the worst engineering-related landslides in the past century occurred in the steep-sided Vajont River valley in Italy, on October 9, 1963. Construction of the Vajont Dam had been completed, but during the initial filling stage a large landslide fell into the lake behind the dam, generating a 250 m-high wave that overtopped the dam wall and swept down the valley. Several villages and towns were destroyed and over 1,900 people were killed (Fig. L27b). Previous reports warning that the mountain slopes behind the dam were unstable had been ignored.
Submarine LandslidesLarge underwater landslides, usually triggered by earthquakes, have caused destructive tsunamis. Some of the most devastating tsunamis have been generated by large submarine slumps that were triggered by earthquakes in coastal regions. In Papua New Guinea on July 17, 1998, a MW 7.0 earthquake caused an underwater landslide offshore from Sissano Lagoon. The displacement of water by the landslide caused a 10 to 15 m-high tsunami (see Tsunami Chapter) that killed over 2,000 people in the town of Aitape and nearby coastal villages. Three schools were among the hundreds of destroyed buildings (Fig. L28a). Another example occurred on November 18, 1929, when a MW 7.2 earthquake off the Grand Banks, Newfoundland, Canada, triggered a submarine landslide that in turn generated a tsunami. The slumping sediments destroyed several kilometers of transatlantic telegraph cables, and the tsunami caused 29 fatalities and over $400,000 in damages (Fig. L28b).
Attabad Lake, Pakistan, 2010Landslides often block rivers and create lakes behind the debris fall. Rising water levels in the new lake can be devastating to villagers upstream. In January 2010, a large landslide near Attabad village in the Gojal Valley of northern Pakistan killed 20 people and, together with secondary landslides (Fig. L29a), it blocked the flow of the Hunza River for several months. Over 6,000 people were displaced. The landslide created Lake Attabad behind the debris. The lake initially was less of a concern than the blockage of the main Karakorum Highway, which prevented villagers upstream from obtaining necessary supplies (see also Fig. L12b). However, as the weeks and months passed, the lake behind the debris dam began to fill the valley Over several months, villages and farms were slowly inundated (Fig. L29b) and 19 km of the Karakoram Highway became submerged. The diverted highway, with 5 new tunnels, is now being completed in a cooperative effort between Pakistan and China at a cost of $275 million.
RecoveryRecovery after a landslide is possible, but costly. Recovery after a major landslide is expensive. Entire villages and towns may need to be moved to new locations. Homes, transportation routes, bridges, pipelines, schools, businesses, and other infrastructure will need to be rebuilt. Agricultural land is often slow to recover, especially in normally arid regions or where fertile topsoil has been buried by rocky debris. Reconstruction of highways in mountainous terrains is especially challenging. Five new tunnels, 2 new bridges and 78 new culverts had to be constructed along a 7 km stretch of the Karakoram Highway after a 2010 landslide took out the road and blocked the Hunza River in Pakistan, creating Attabad Lake (Fig. L30a). In urban areas, where a landslide risk remains and the population density is too high to be moved easily, construction of expensive, but necessary, diversion channels can help mitigate the effect of future mudflows (Fig. L30b).
Slope StabilizationSteep hill slopes can be stabilized by terraces held in place by walls of local materials, which can help direct surface water away from unstable ground. The terracing of hill slopes has been a practice around the world for centuries (Fig. L31a). Terraces have two advantages: in dry climates, some water is retained in the soils behind the retaining walls; secondly, and of greater importance for unstable slopes in wetter climates, terraces force water to move across, rather than straight down the hill slope. This slows the downhill movement of water and reduces the likelihood of a debris flow. Where available, local stones are used for the terraces’ retaining walls. When correctly constructed, the walls require neither mortar nor cement (Fig. L31b). In countries that do not have readily available large stones, such as in parts of the southern Himalayas and the Caribbean, other locally available materials can be equally effective (Fig. L31c). Where feasible, it is even more effective to add material to the base of the slope behind retaining walls in order to reduce the overall slope of the hillside and its potential for sliding.
Landslide Risk AssessmentThe economic losses caused by landslides around the world each year are considerable, but mitigation, including mapping, monitoring, and prediction, leads to improved safety Any region in the world that has a combination of high relief and heavy rainfall is likely to experience frequent, often fatal, landslides. A 2004 report estimated the average annual cost of landslides in the U.S.A. alone as more than $3.5 billion. Slope failures are exacerbated by expensive modern infrastructure needs that require disturbing large amounts of earth. In Europe, North America, and other developed countries, the direct economic cost of landslides is far greater than in lessdeveloped countries, even though the average annual loss of life is much lower. Devastation from landslides can be reduced by effective risk assessment, mitigation, and disaster management. Most of the landslide-prone regions of the world now have landslide hazard maps to assist in planning for mitigation and recovery efforts (Fig. L32). By using and refining risk assessment protocols it is possible to avoid locating new large-scale constructions in the path of a potential slide. Unfortunately, people in densely populated, under-developed countries may have no option but to remain living in areas that have a high landslide risk. The region may not have the economic means to invest in mitigation efforts nor in large-scale relocation of its people. The direct economic loss of landslides for them is in the loss of family members, their homes and villages, and farm lands that represent decades of hard work.
Class Reading Listvan Westen, C., n.d., Introduction to landslides. Part 1: Types and Causes. pdf. van Westen, C., n.d., Landslides. Chapter 4 in Methodology Book, Caribbean Handbook of on Risk Management (CHARIM). html. Back to ContentsLab 7: Volcanoes and LandslidesVolcanoesQuestion Set 5 includes three questions related to volcanoes. LandslidesQuestion Set 5 includes one question related to landslides.
Rotational debris and earth slides (Fig. L3b), also known as slumps, are among the most common and they can also be the most deadly. |