Fall 2018: Natural Hazards and Disasters
Natural Hazards and Disasters
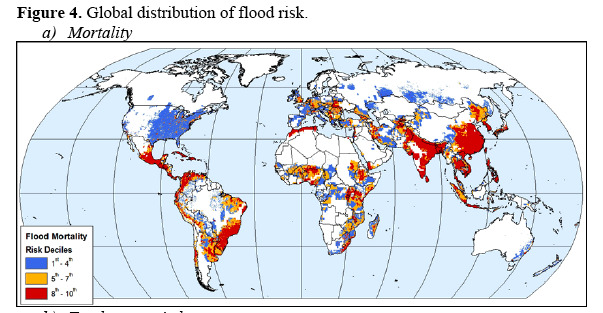
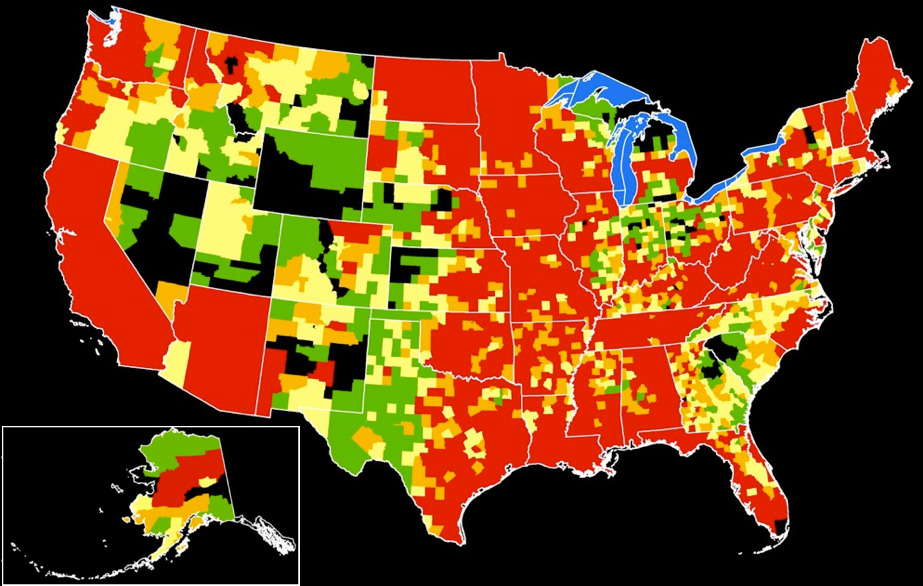
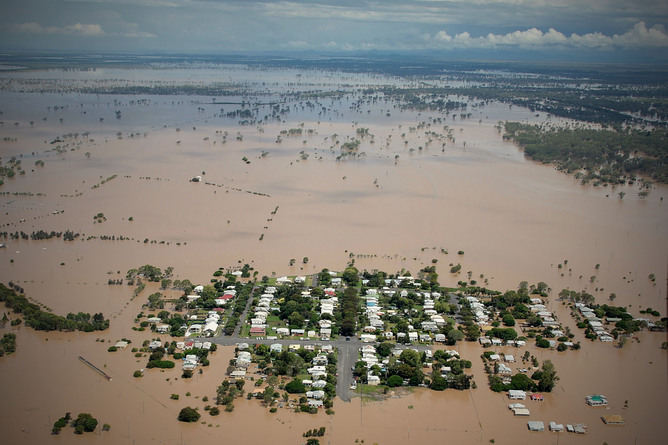
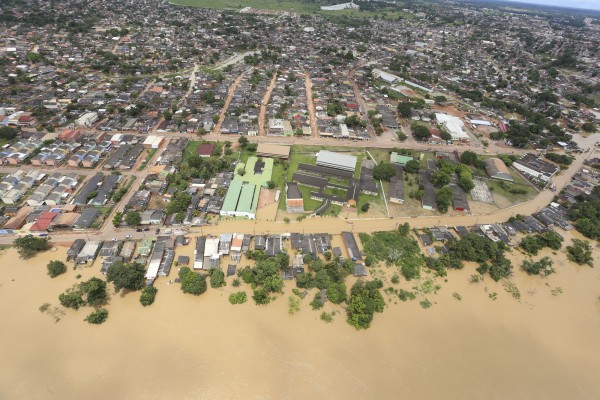
Class 8: Water Cycle and FloodsWater CycleFor an introduction to the global water cycle, see, e.g., UCAR (2011). FloodsWater is essential for life, and humans have a strong tendency to live and work close to water. While being close to rivers, steams, lakes, and the ocean may be convenient, it also comes with the risk of catastropic flooding. Heavy and continuous rain can lead rivers to flood and lake barriers to break. Close proximity to the ocean carries the risk of storm surges and tsunami inundation. Floods are the natural hazards that impact the largest number of people and cause the largest amout of damage. Catastrophic flooding can occur in any low-lying region adjacent to rivers, streams, or the ocean. Water is essential for life, and humans naturally live, farm, and fish near water sources. Close proximity to rivers and streams may be convenient, but there is a significant risk of flooding during times of heavy or continuous rain. Close proximity to the ocean carries the risk of storm surge and even tsunami inundation. The highest risk of catastrophic flooding occurs in low-lying coastal areas (Fig. F1a) and those regions most at risk from tropical cyclones, such as Central America, Southeast Asia, coastal Brazil, and the southeastern U.S.A. (Fig. F1b). Moderately high risk flood zones include mountainous areas that receive significant rainfall and inland regions where major rivers run through low topography, such as the Indian sub-continent (Fig. 1c), parts of south-central U.S.A., Europe, and east Africa. Lowrisk does not mean no-risk, as even arid regions can be inundated by unusually intense storms.
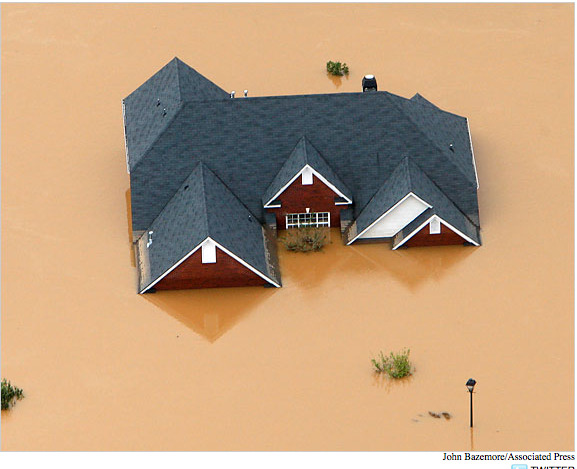
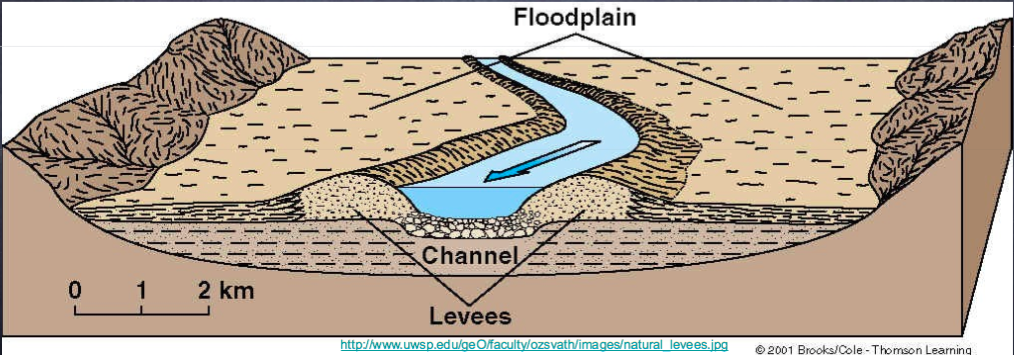
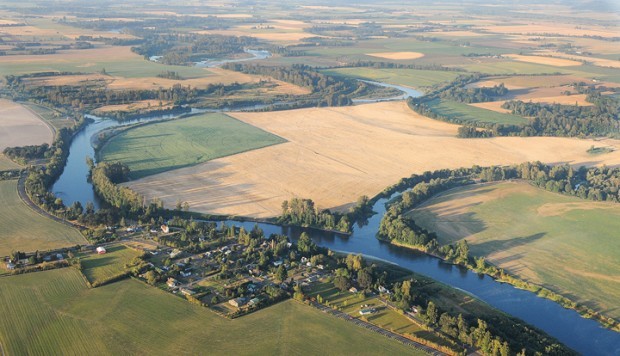
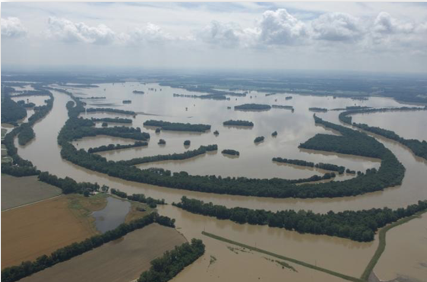
FloodplainsFloodplains are the flat areas adjacent to river banks that have been built up by repeated floods. After exceptionally heavy or persistent rains, or during rapid snowmelt, surface water drains into streams and rivers faster than it can be carried away downstream. The presence of vegetation will slow down surface runoff, but not enough to prevent the river overflowing its banks and natural levees (Fig. F2a). Floodplains are the areas of flatlying land behind the levees, adjacent to the river; they are composed of sediments deposited from the river after repeated flooding events. Floodplains usually contain fine-grained, mineralrich silt, which helps to make fertile soil. Ancient Egyptians watched for the annual flooding of the Nile River during the rainy season and planted their grain crops on the river’s floodplain after the floods had retreated. Today, farmers around the world cultivate crops on floodplains (Fig. F2b), despite the risk that their crops could be inundated by flood water after heavy rainfall (Fig. F2c).
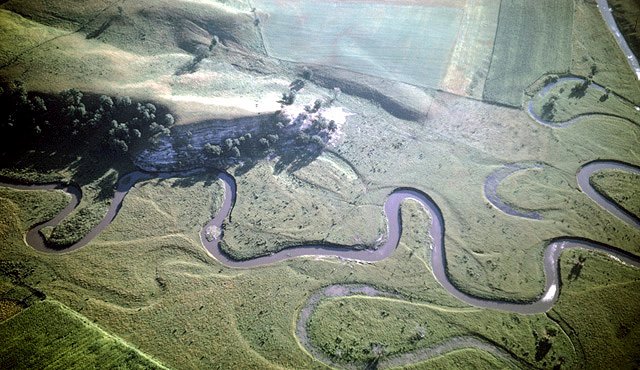
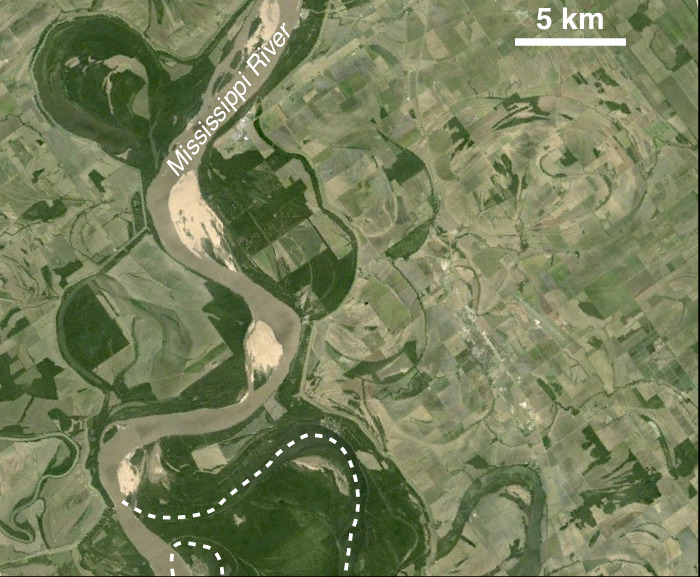
Meandering RiversRivers in flat-lying country meander about within their floodplains. When in flood, the river takes the easiest route downslope. In low-lying regions and areas that have a relatively flat topography, rivers seldom stay in the same channel for very long. The river water gradually erodes the outer curves of the river banks and deposits the sediment on the inner curves further downstream, so that the river channel migrates across the floodplain over time (Fig. F3a). Often, a river’s meander loop is so extreme that it approaches a teardrop shape, after which an increase in water velocity can cause the river to cut off the loop and take a shorter route down slope. The abandoned meanders are usually recognizable by soil and gravel changes (Fig. F3b). The Mississippi River in central U.S.A. is a typical meandering river within a wide floodplain that is intensely farmed. Figure F3b illustrates the river’s numerous long-abandoned meanders, many of which are clearly still visible on satellite imagery.
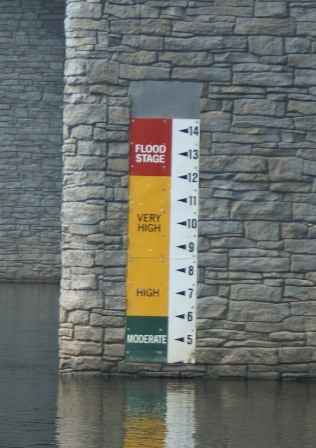
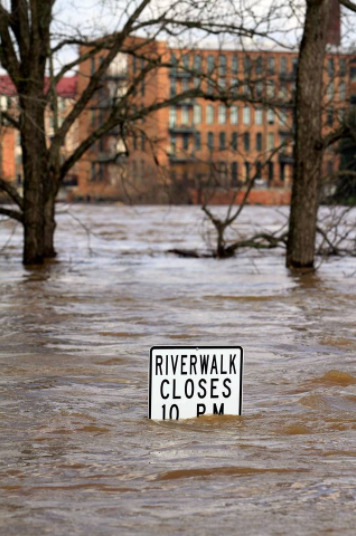
Flood StageA river is in flood stage when its water covers large areas that are not normally under water. A river’s stage is the surface level of water above an arbitrary fixed point and is recorded as height above that level. River depth varies greatly from place to place, due to shallows, ledges, potholes, etc. in the river bed, but the water’s surface height – the river’s stage – is consistent regardless of any riverbed variations. A river’s normal stage could range from a few centimeters to a meter or so in its upper reaches (Fig. F4a), to several meters in a big river such as the Mississippi River. River discharge is the volume of water that passes with time, measured in cubic meters per second (m3s-1) or cubic feet per second. Increased discharge naturally results in a higher river stage. A small volume of floodwater when the river overtops its banks may be just inconvenient, but when the water surface reaches a level such that regions not normally covered by water are inundated and there is a threat to life or property, the river or stream is said to have reached flood stage. Flood crest is level of the highest flood stage reached (Fig. F4b).
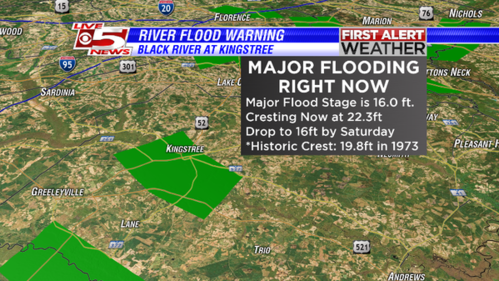
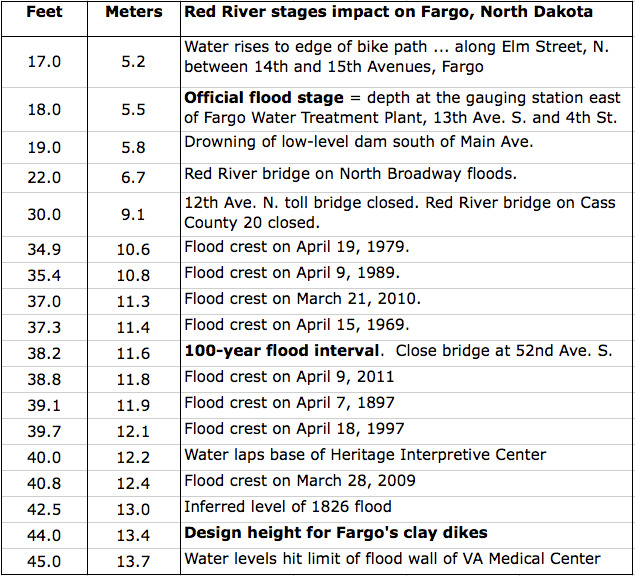
The 100-Year FloodA “100-Year flood” is a 1% probability of a flood of a certain volume in any given year. River and stream flooding is a normal and frequent occurrence. The term “100-year flood” means that there is a one-in-a-hundred (1%) probability of a flood of a certain volume occurring in that particular area in any given year. It does not mean that such a flood will only occur once in 100- years (Fig. F5a). Similarly, a 500-year flood means there is a 0.2% probability in any given year. How often a river or stream floods depends on the regional climate, frequency of severe storms in the catchment area, and the local topography. A 100- year flood could occur several times in a century, and even in two consecutive years. Probability assessment relies upon historical data to establish the base-line for flood frequency and discharge rates. Previous flood crest heights and other inundation information (Fig. F5b) are used as part of the planning process for building flood mitigation structures such as artificial levees.
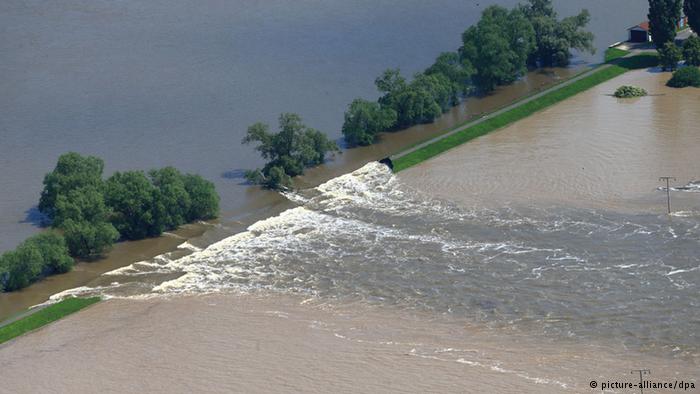
Just Build More Levees?Levees to protect against river flooding can be effective, but are not without problems. Levees are natural or man-made barriers along river banks. By keeping the water in its channel they allow people to live and farm close to rivers and streams. In practice, levees are only effective if they are well -constructed and well-maintained. They are usually made of earth (Fig. F6a) and built to resist the highest expected flood stage. However, even the best-constructed levees can be breached under the pressure and erosive power of excessive flood water (Fig. F6b). The use of levees can sometimes provide a false sense of security, encouraging more development behind the barrier than might be wise (Fig. F6c). By limiting the lateral spread of floodwater, its height in the constraining channel is automatically increased and therefore it is more likely to overtop the levee. Also, the constricted flow may cause flood water upstream to pond behind the levee and spread even further over the floodplain.
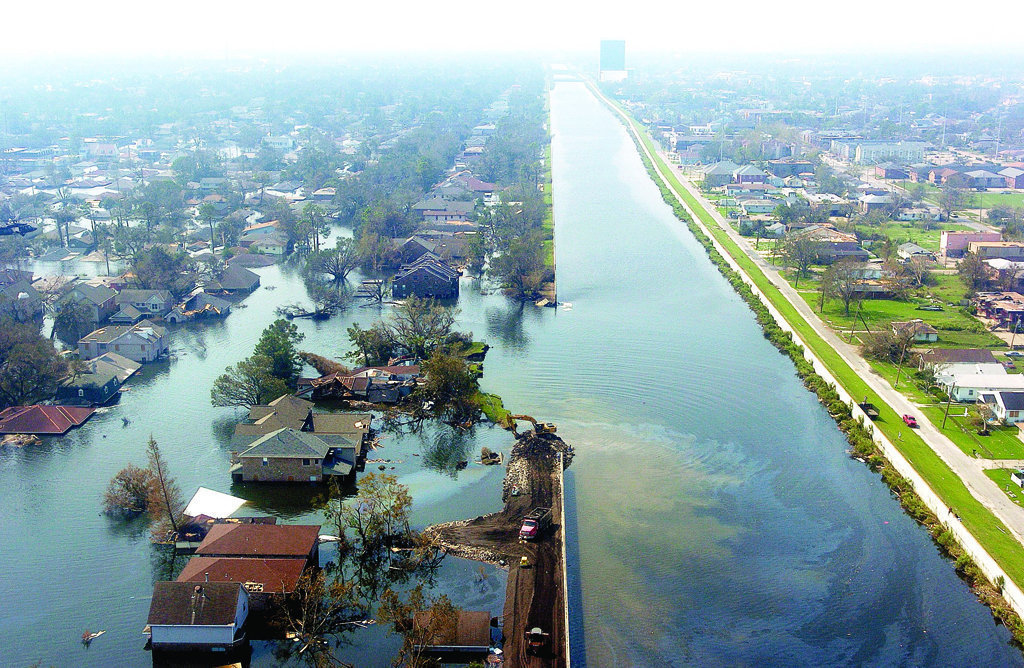
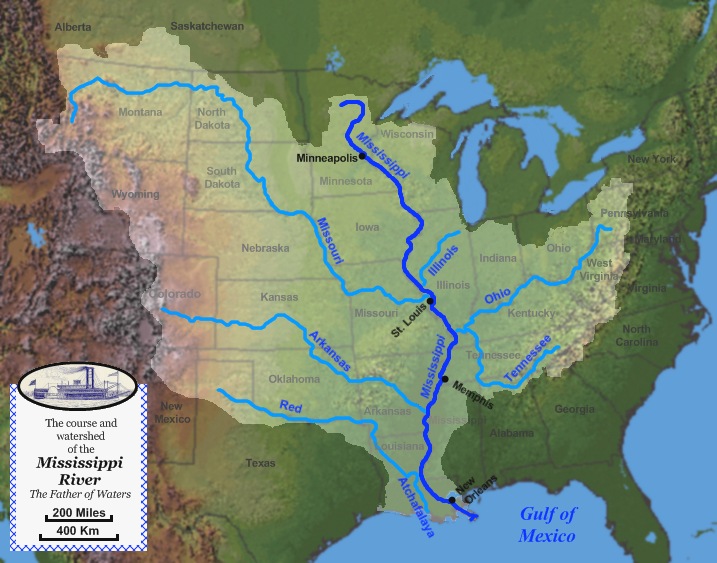
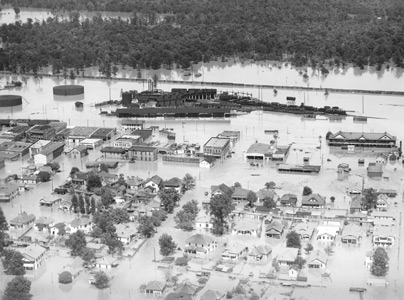
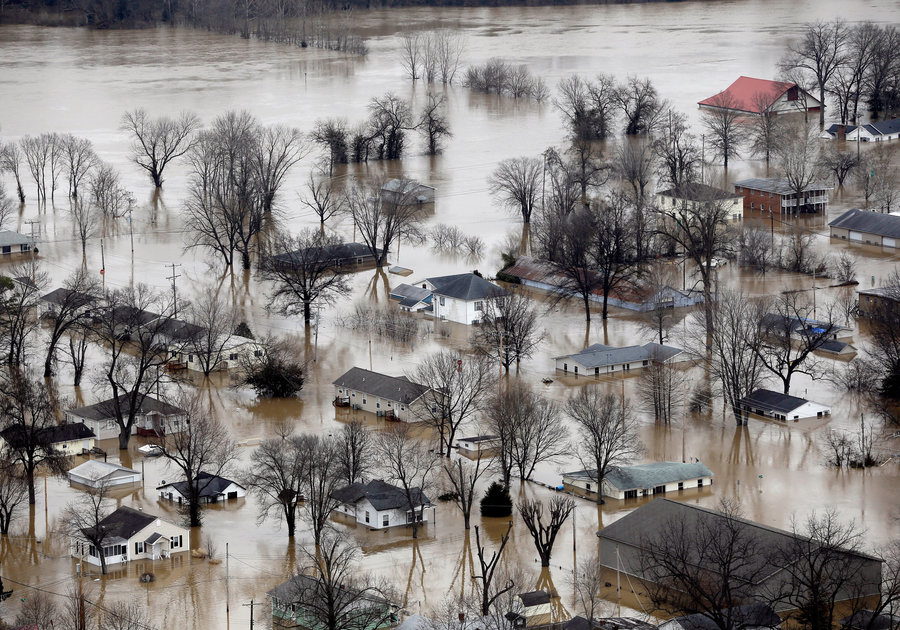
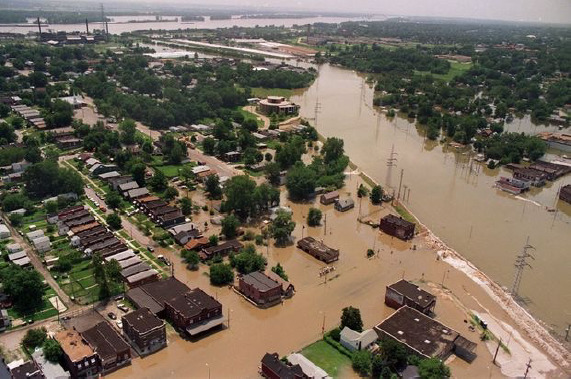
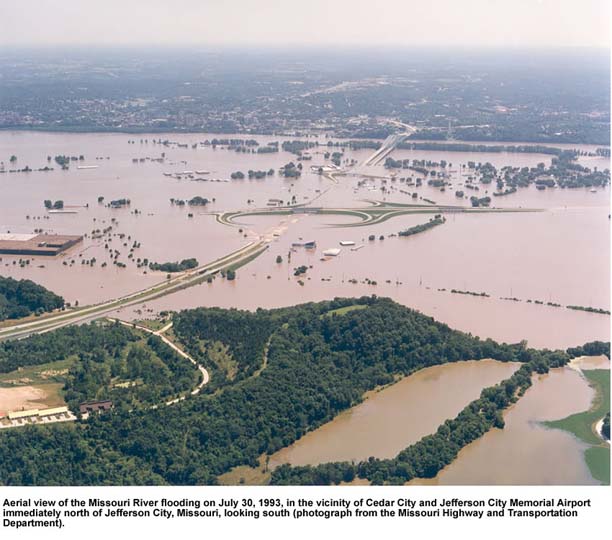
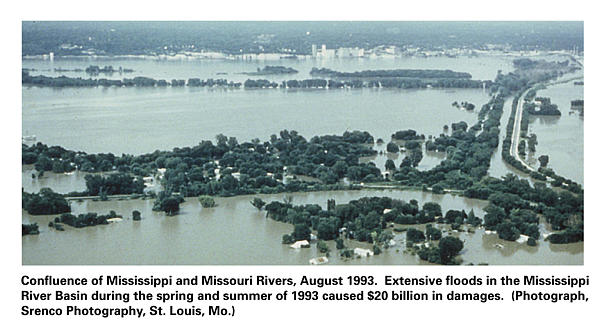
Midwest U.S.A. FloodsThe Mississippi River system includes several large tributary rivers, each of which has caused repeated devastating floods. Excess water in any of the feeder rivers of the Mississippi River system (Fig. F7a) doesn’t only spill onto their own floodplains, but can lead to extensive flooding of the Mississippi floodplain as well. Flood waters from the Upper Mississippi, Missouri, and Illinois Rivers have frequently inundated the city of St. Louis, MO and its surroundings; the Ohio River adds to the flood threat for the city of Memphis; and water from the entire Mississippi River system flows via New Orleans into the Gulf of Mexico. Countless levees have been built over decades to protect the cities and towns that continue to be developed and expanded in the midwest U.S.A. floodplains. Despite careful engineering, extreme flood stages regularly cause the failure or overtopping of these levees, resulting in widespread damage, disruption and, inevitably, flood-related fatalities (Fig. F7b).
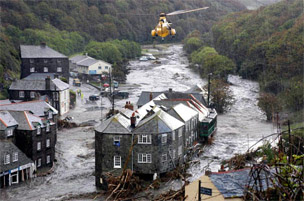
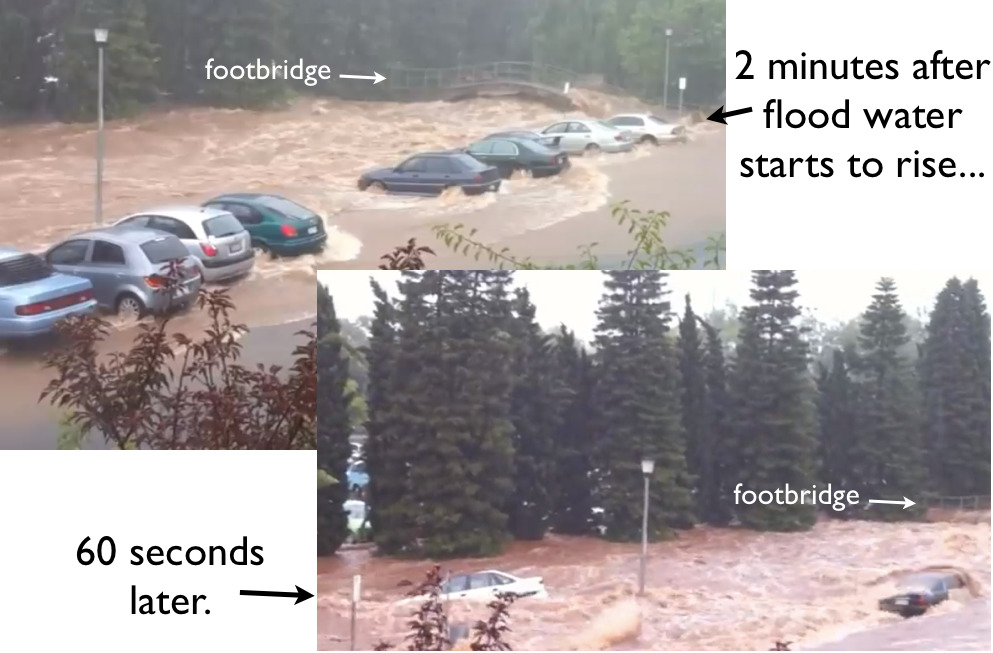
Flash FloodsFlash floods occur unpredictably.after severe thunderstorms or a sudden release of snow melt. Flash floods are the most dangerous of all flood types because they occur without warning in response to an event that may be far away from the scene of the flood. When rain falls much too quickly for it to be absorbed or drained away at a steady rate, the surface water funnels into numerous narrow streams which then coalesce into a torrent that surges along the river bed (Fig. F9a), often picking up large amounts of debris from the stream and river banks along the way. There is usually only a very short time interval between the intense rainfall and the start of the flash flood surge. As the flood front moves downstream, the flood waters behind it rise extremely rapidly (Fig. F9b) and the flood stage can become very high, especially in narrow mountain valleys. Many deaths are caused by people greatly underestimating the rapidity with which the water can rise in a flash flood.
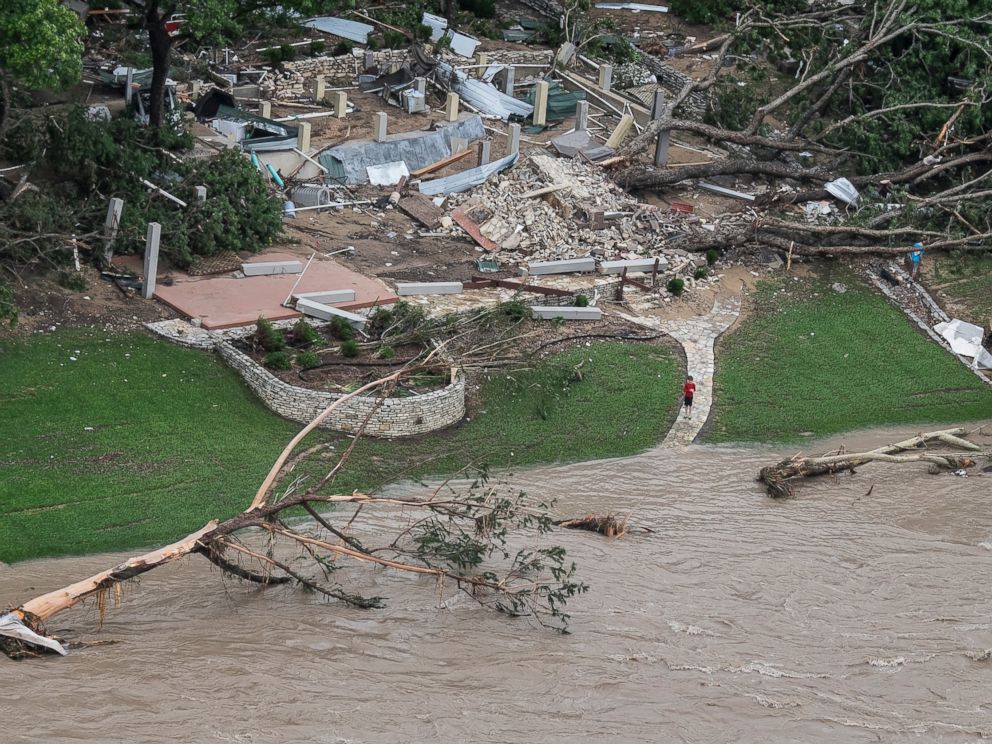
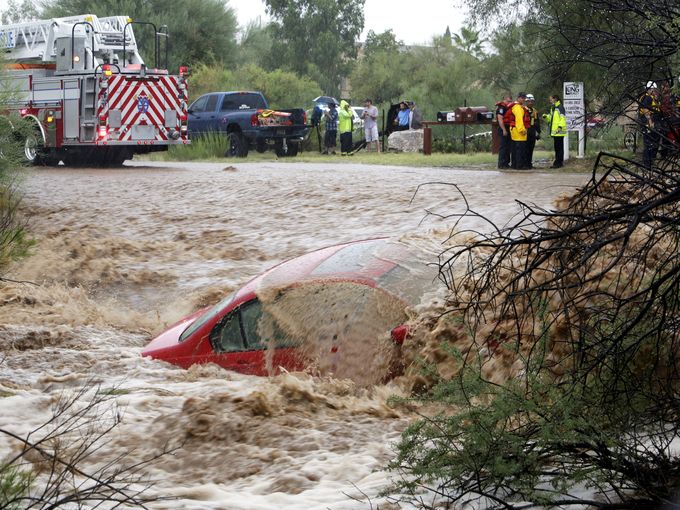
Flash Floods In The DesertOtherwise dry rivers in desert regions flood when surface runoff exceeds river channel capacity. The desert regions of the southwest U.S.A. are not usually thought of as high flood-risk areas, however they can be almost as flood-prone as the mid-western states (Fig. F10a), but for different reasons. Arid regions have little vegetation to impede surface run-off. What little rain does fall comes from isolated, high intensity thunder-storms that cause localized flash floods. The storms may be occurring a long distance away, but flash flood water travels quickly over the dried-out clays that line river beds, which are unable to absorb water fast enough. There is very little time to warn residents who may be in the path of the flood. Flash flooding from days of torrential rain in May 2015 destroyed hundreds of homes in Texas and Oklahoma (Fig. F10b). Later the same year, several days of unusually heavy rains and thunderstorms again caused destructive flash flooding throughout the states of Texas and Arizona.
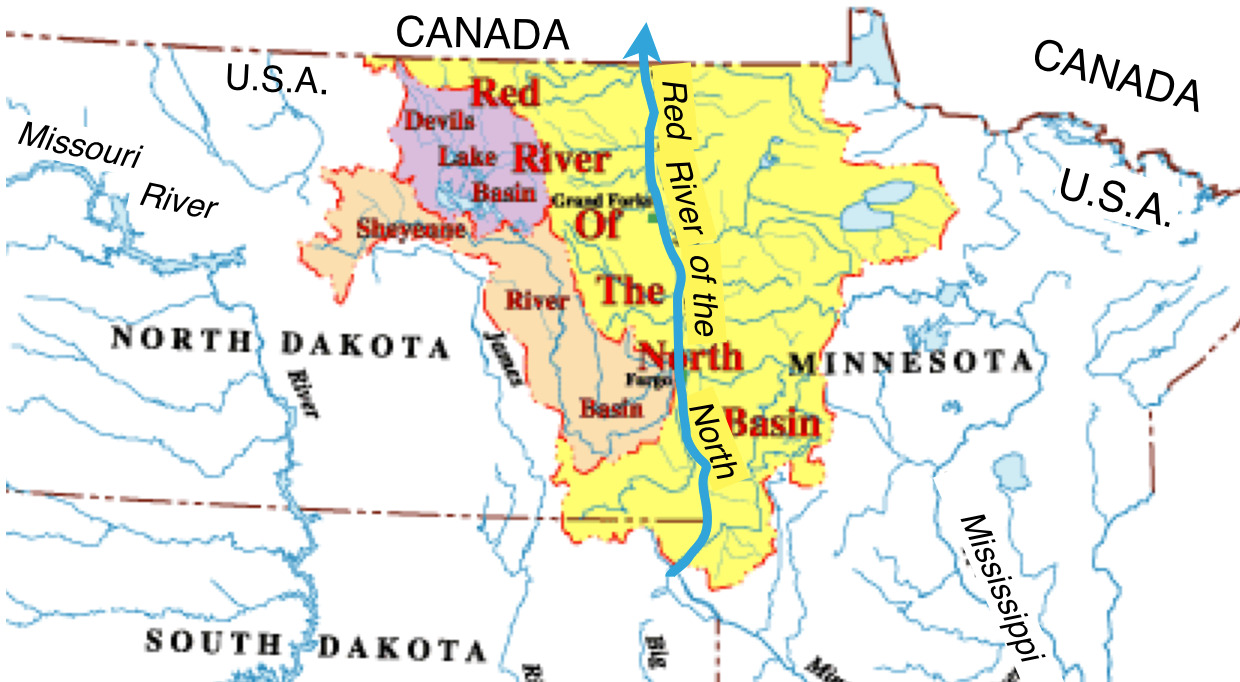
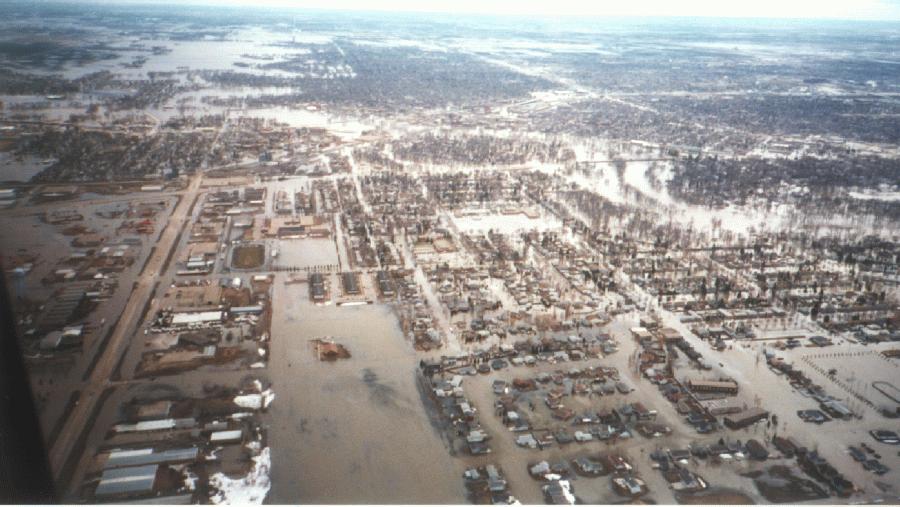
Snowmelt FloodsRapid snowmelt during exceptional warm periods or heavy rain often causes floodplain inundation. In the colder regions of the world, water from snowmelt runoff is a normal and major contributor to river discharge in springtime. However, spring rains on top of winter snow can cause very rapid melting that can result in a greater discharge volume than rivers and streams can accommodate. Snowmelt floods are common along the Red River of the North (Fig. F11a), which drains from Minnesota, U.S.A., northward into Canada. One of the river’s more extensive floods inundated several cities in its floodplain in April 1997, when very heavy snowfall from the previous winter began to melt in spring. Melting began as usual on the south-facing hill slopes of the river’s catchment area, but a sudden severe blizzard in early April re-froze sections of the river to the north and caused ice jams, which blocked the northward flow of the meltwater. The city of Grand Forks, ND was especially hard hit by the flooding (Fig. F11b).
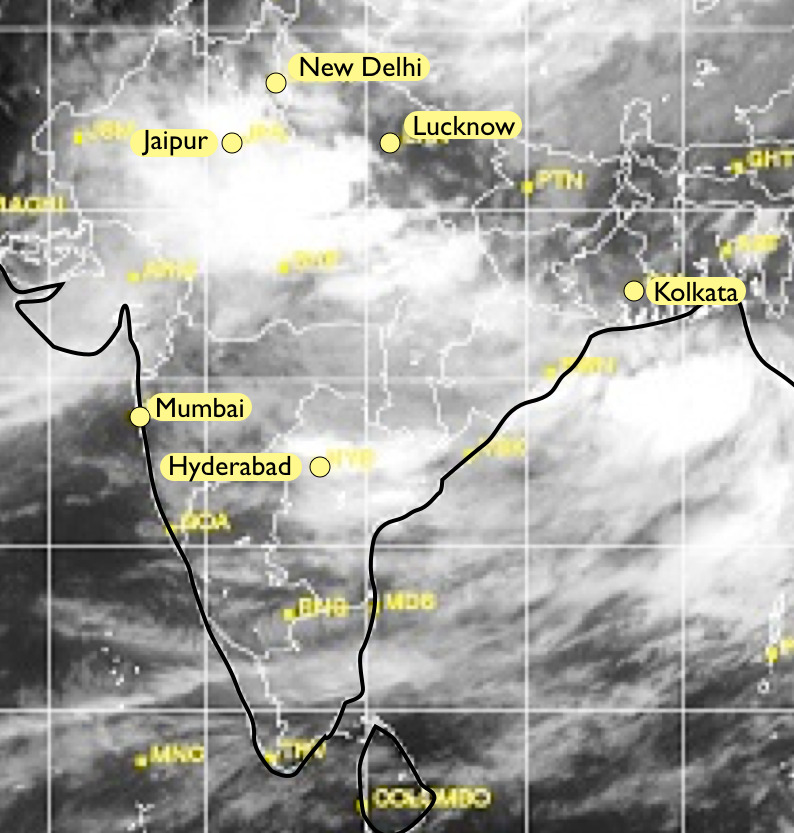
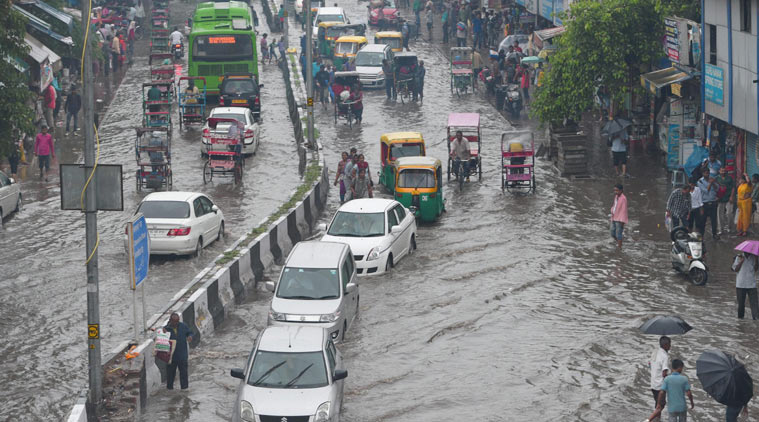
Monsoons Are Not TyphoonsMonsoons are seasonal prevailing winds that bring heavy summer rains to southeast Asia. The monsoons of southeast Asia are seasonal winds that are driven mainly by the differential heating of land and ocean surfaces. In winter, they bring dry northern air to southeast Asia. In summer, they reverse direction as rising hot air above the land creates low pressure regions that draw in cooler, moist air from the Indian Ocean. The warmed moist air rises to form widespread, dense rainclouds (Fig. F12a). The term, ‘monsoon’ usually refers to these wet summer monsoons, which are highly unpredictable in intensity and duration. In contrast, typhoons are isolated, relatively short-lived, rotating tropical cyclones that deliver intense rain along with high winds. Normal monsoon rains often last for weeks and may create disruptive, but not dangerous floods (Fig. F12b). However, in years of exceptionally heavy monsoons of long duration, destructive flooding can occur in low-lying regions (Fig. F12c).
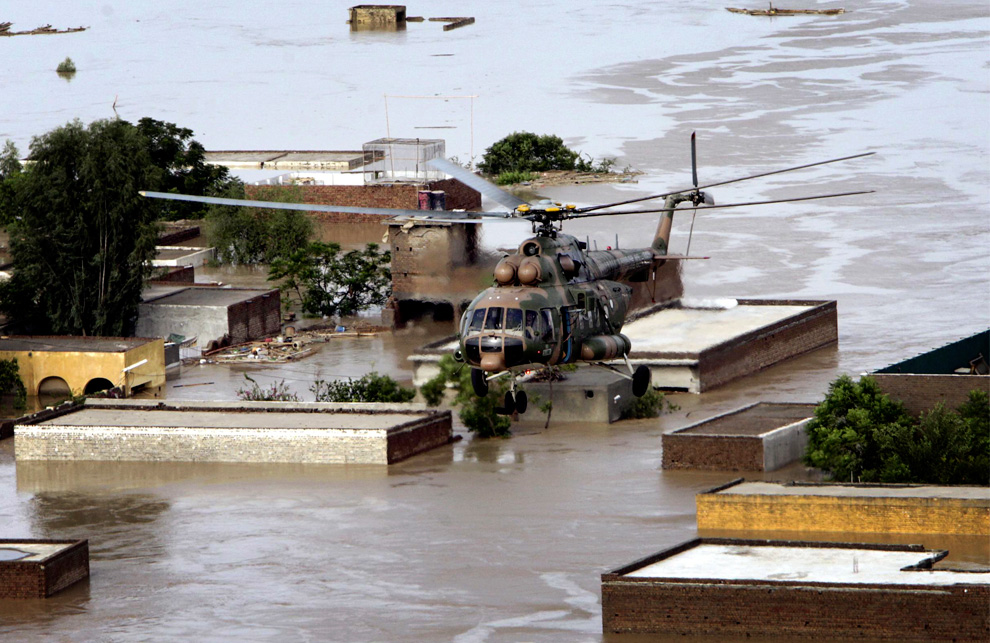
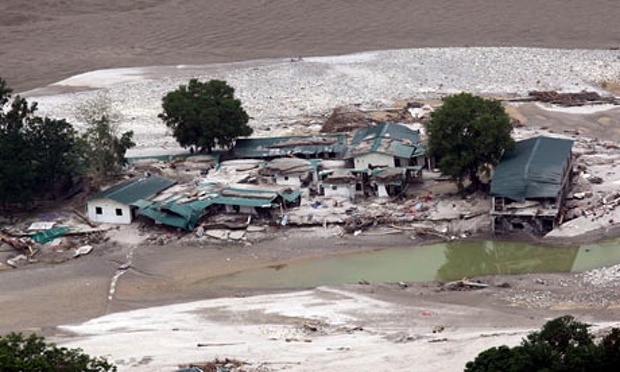
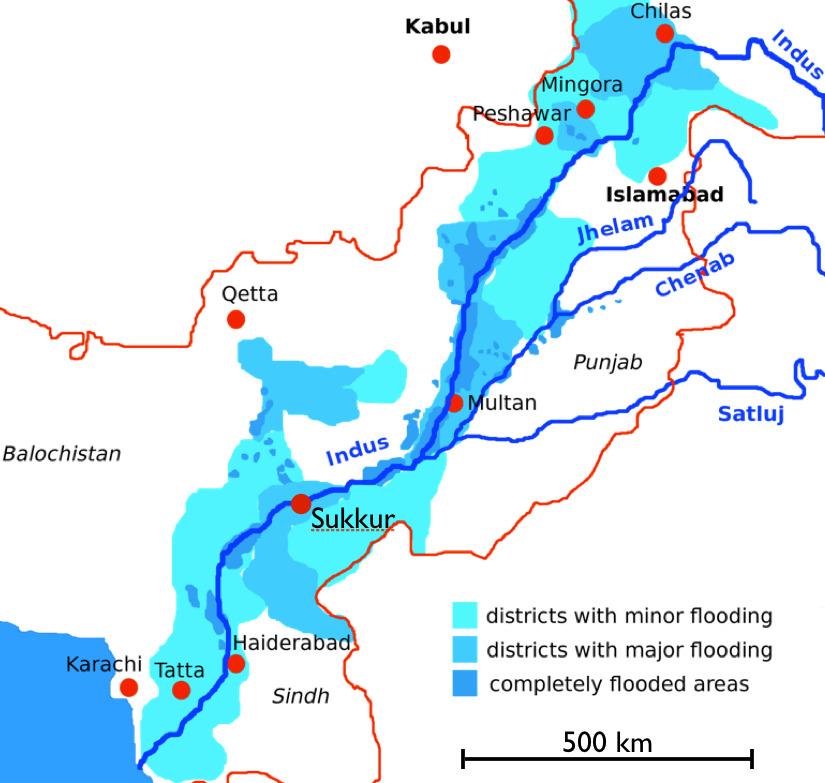
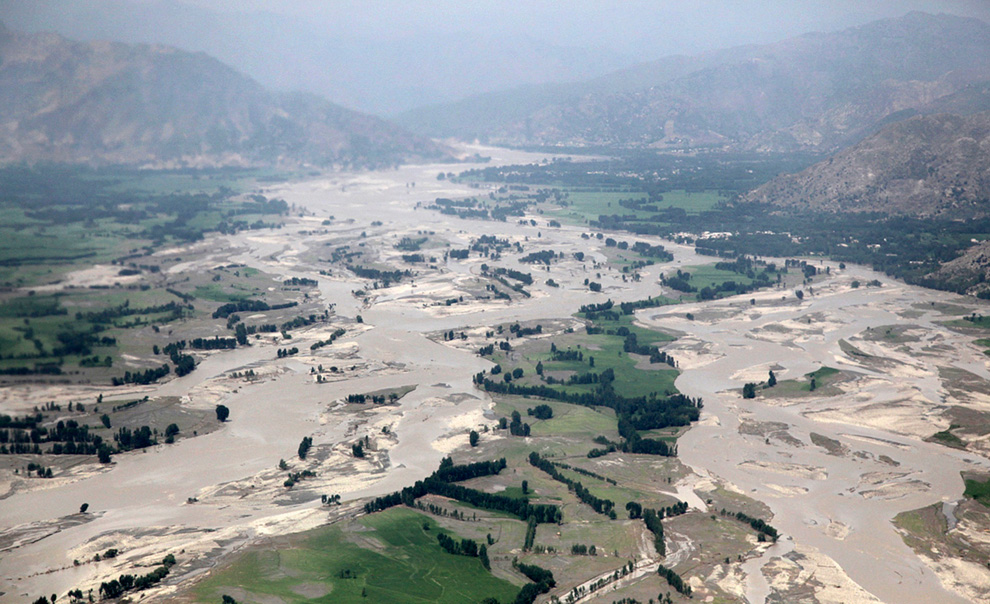
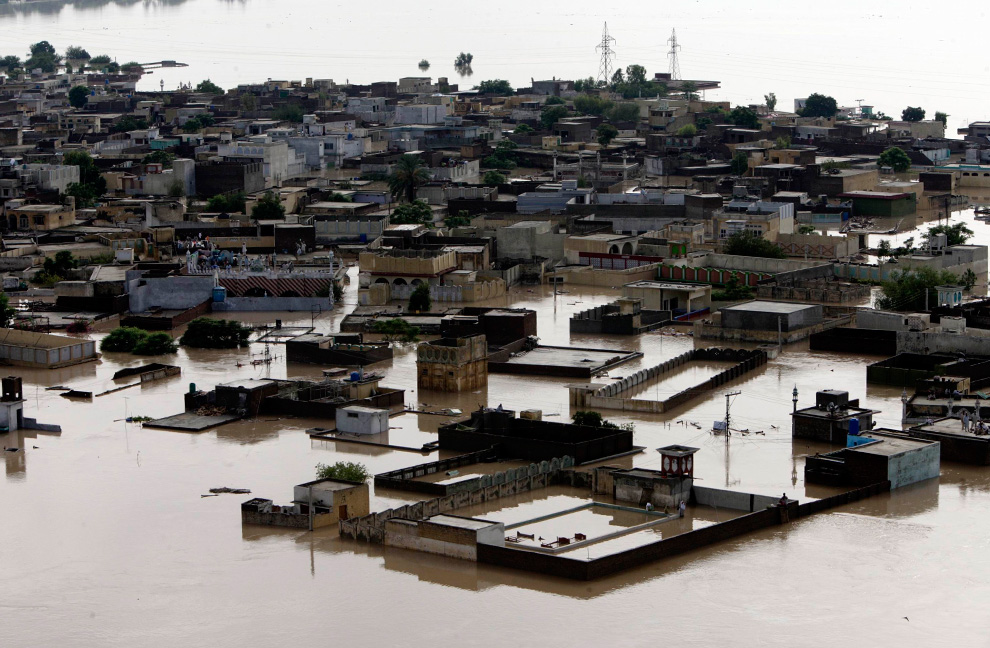
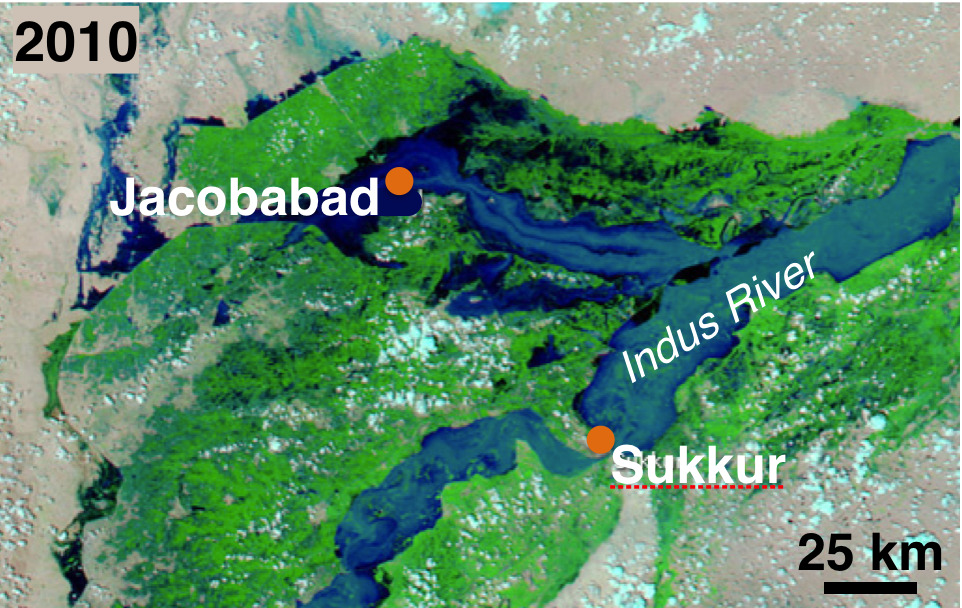
Indus River Flood, 2010Unusually heavy monsoon rains in late July and early August 2010 caused the entire Indus River floodplain to be inundated. In late July and early August 2010, several days of extremely heavy monsoon rain caused flash floods in the upper reaches of the Indus River, northeast of Peshawar, Pakistan (Fig. F13a). The floods caused hundreds of fatalities and the destruction of 160 km (100 miles) of roads, along with countless homes (Fig. F13b). Within a few days, the Indus River crested north of Multan, where almost 3 million people were affected by floods. As the flood crest moved down-river over the following weeks, the broad floodplain of the Indus River near the cities of Jacobabad and Sikkur (Fig. F13c) became overwhelmed by flood waters. Jacobabad was totally inundated by August 24 and large areas of Sikkur were also submerged. In this area alone, more than 1,500 square km (1,000 square miles) of land and at least 530 villages and 13 towns were flooded, and more than 500 km (300 miles) of roads were destroyed.
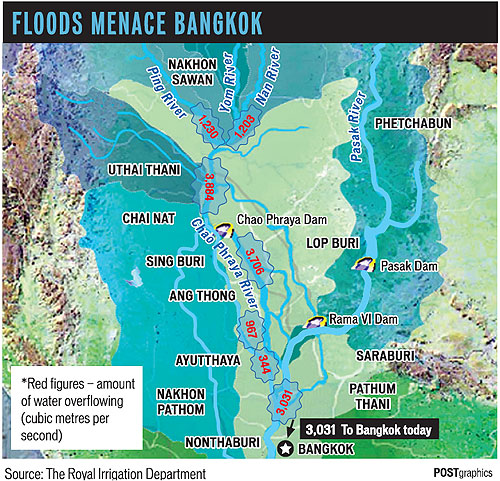
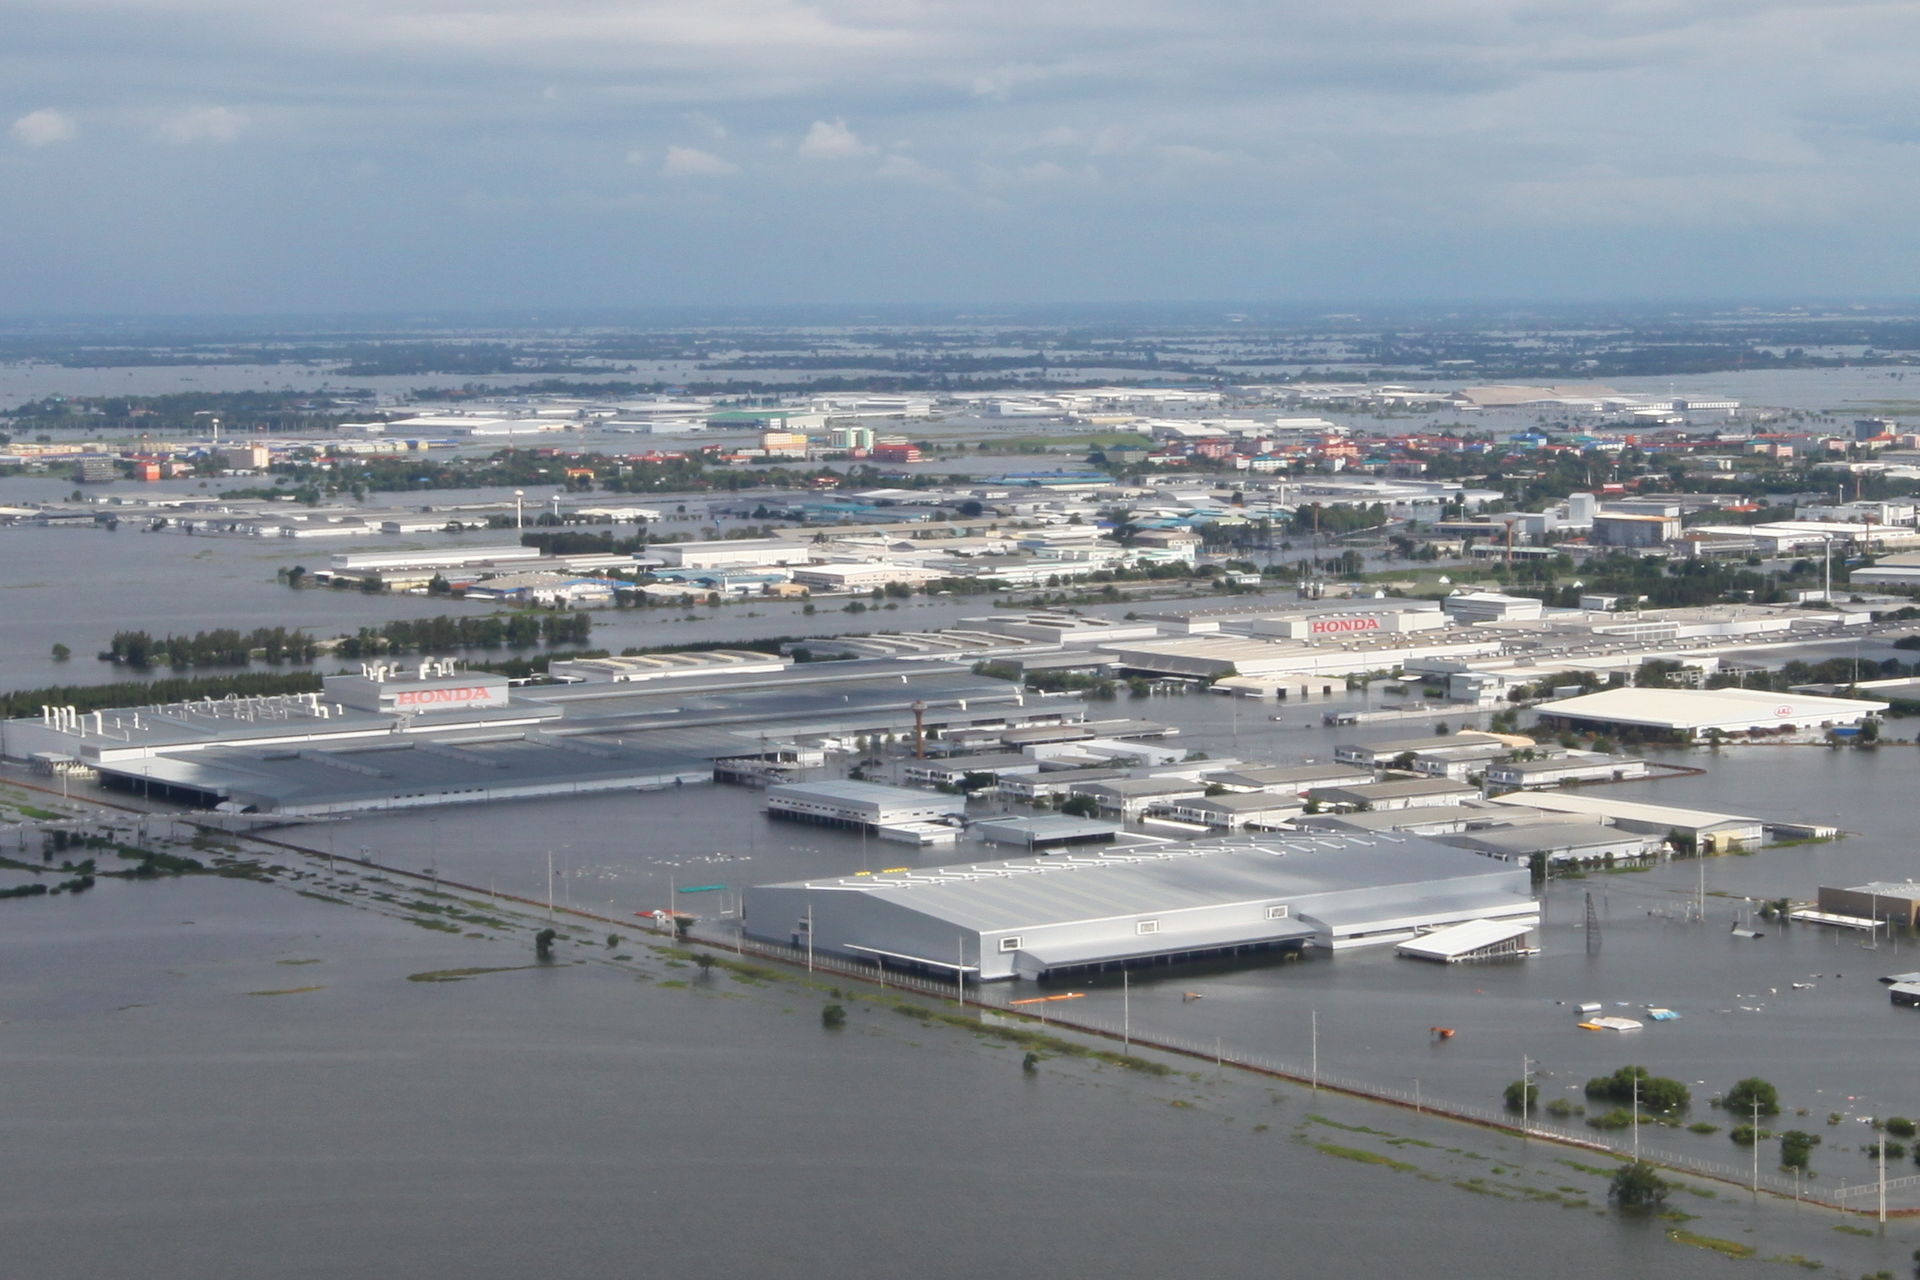
Monsoons And DamsDams are used to retain and conserve water and to control river discharge - not always with success. Monsoon rain in Indochina and southwest China regularly causes moderate floodplain inundation that farmers rely on for irrigation. The river discharge at any one time, and thus the degree of floodplain inundation, is controlled by the use of dams. However, unusually heavy rain in Thailand in 2011 overwhelmed the capacity of their dams and resulted in widespread destructive flooding. Intense rain began in the north of Thailand in May 2011 and continued for weeks in response to a strong La Niña. By August, the three large dams that normally regulate the Chao Phraya and Pasak Rivers’ discharge (Fig. F14a) were so full that they had to release water into already swollen rivers. Flood barriers failed as flood crests moved downriver, until by mid-October, towns in the central floodplain were flooded and the capital city of Bangkok was threatened. Industrial as well as residential areas were inundated (Fig. F14b).
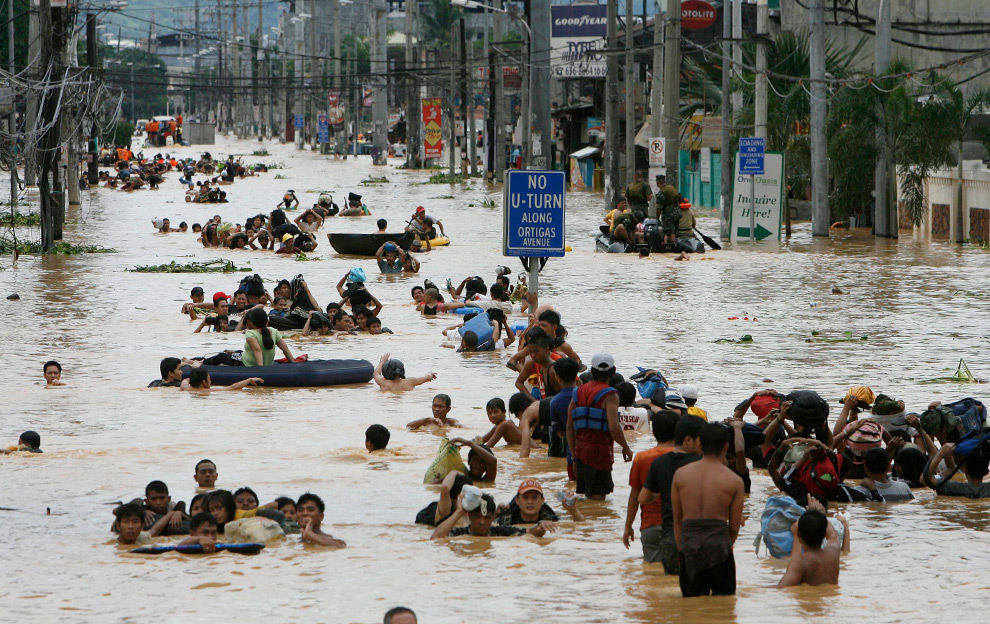
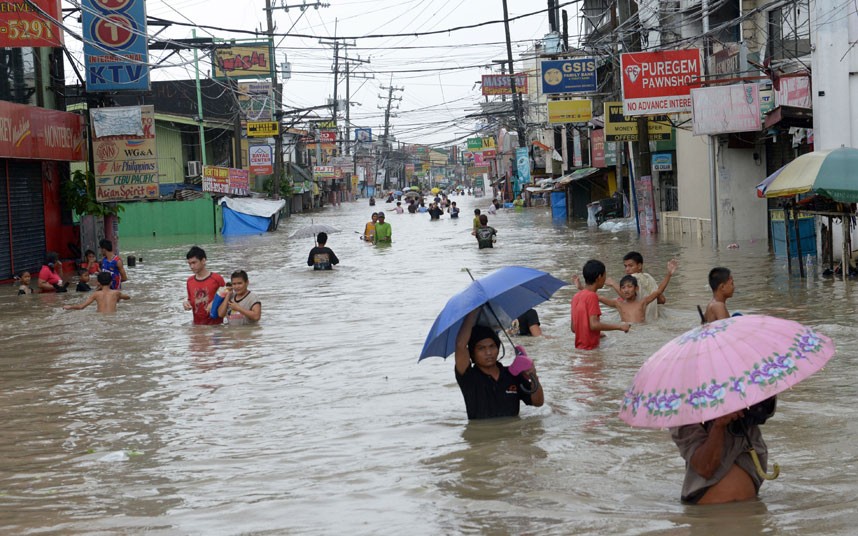
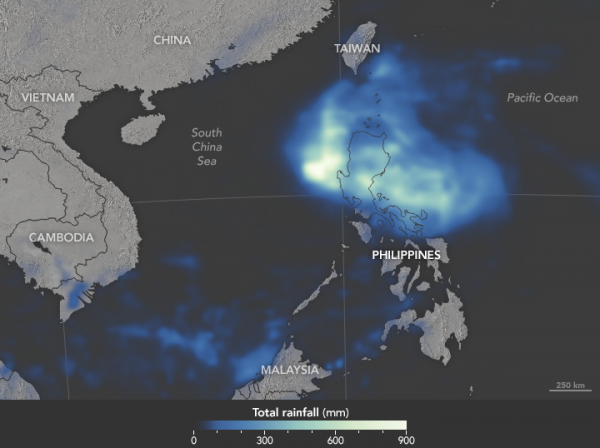
Monsoon + Typhoon = DisasterMonsoon season in the Philippines coincides with tropical cyclone season. When storm and monsoon rains combine, the result is devastating flooding. Severe floods in the Philippines occur on an almost annual basis from one of the frequent tropical cyclones and/or from heavy monsoon rains. Unfortunately, the two seasons both occur during the late summer months. In September 2009, a record 455 mm of rain in 24 hours fell on Manila from Tropical Storm Ketsana, which combined with already heavy monsoon runoff and caused more than 700 fatalities (Fig. F15a). In August 2012, days of torrential monsoon rain were followed by Typhoon Saola. Over 850,000 people were displaced and more than 70 died (Fig. F15b). The following year, monsoons again flooded Manila. Heavy monsoon rain in October 2015 was augmented by 6 days of torrential rain from Typhoon Koppu (Fig. F15c). In that storm, over 500,000 people on Luzon were displaced and thousands of homes were destroyed, but early evacuations saved hundreds of lives.
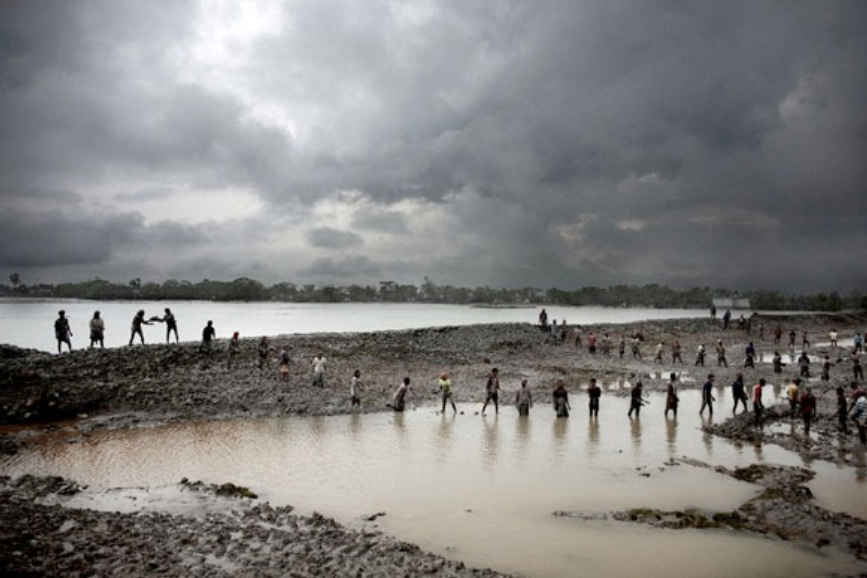
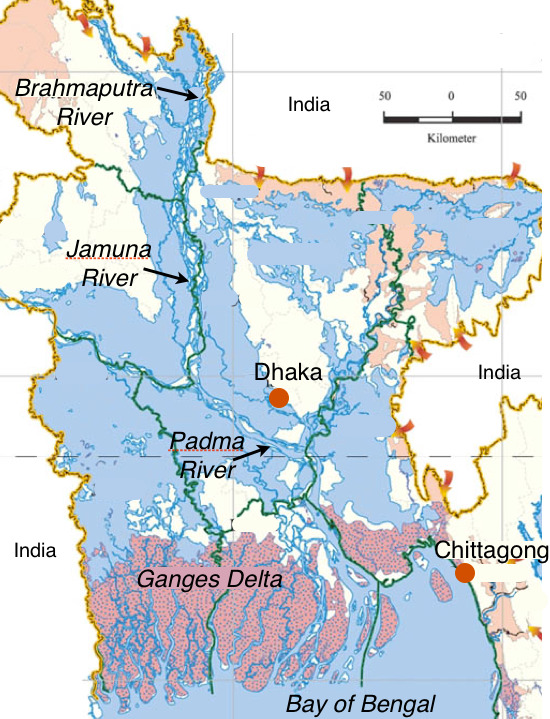
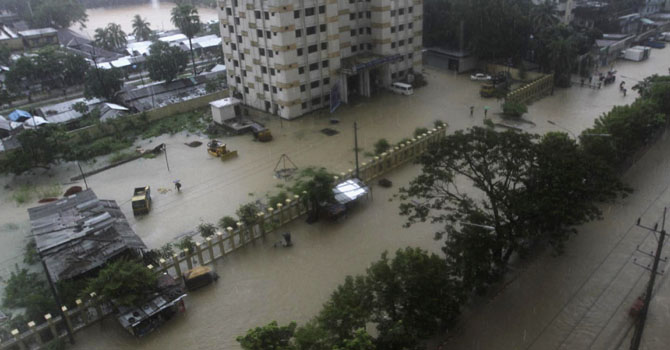
Flood-prone BangladeshMuch of Bangladesh is at a high risk of frequent flooding, from storm surge as well as monsoons. Some countries are more susceptible to flooding disasters than others. Bangladesh is highly vulnerable due to the density of people who live on its flood plains, which comprise over 80% of the country. Himalayan snow melt, flash floods, and intense monsoon rains regularly flood the Jamuna and Padma floodplains along the Brahmaputra river system (Fig. F16a), with loss of lives, homes, and farms. In addition, tropical cyclones that move into the Bay of Bengal cause major storm surge floods in the Ganges Delta, where the land is barely above sea level. Monsoons have caused devastating floods in the country many times in the past century. 1987 and 1988 were especially bad years, and in 1998 twothirds of the country’s crop lands, roads, and homes were under water, affecting over 30 million people. In 2004, monsoon rains created waist-deep water in the usually dry capital city of Dhaka, and in 2012 at least 100 people died in the port city of Chittagong after very heavy rains set off flash floods and landslides (Fig. F16b).
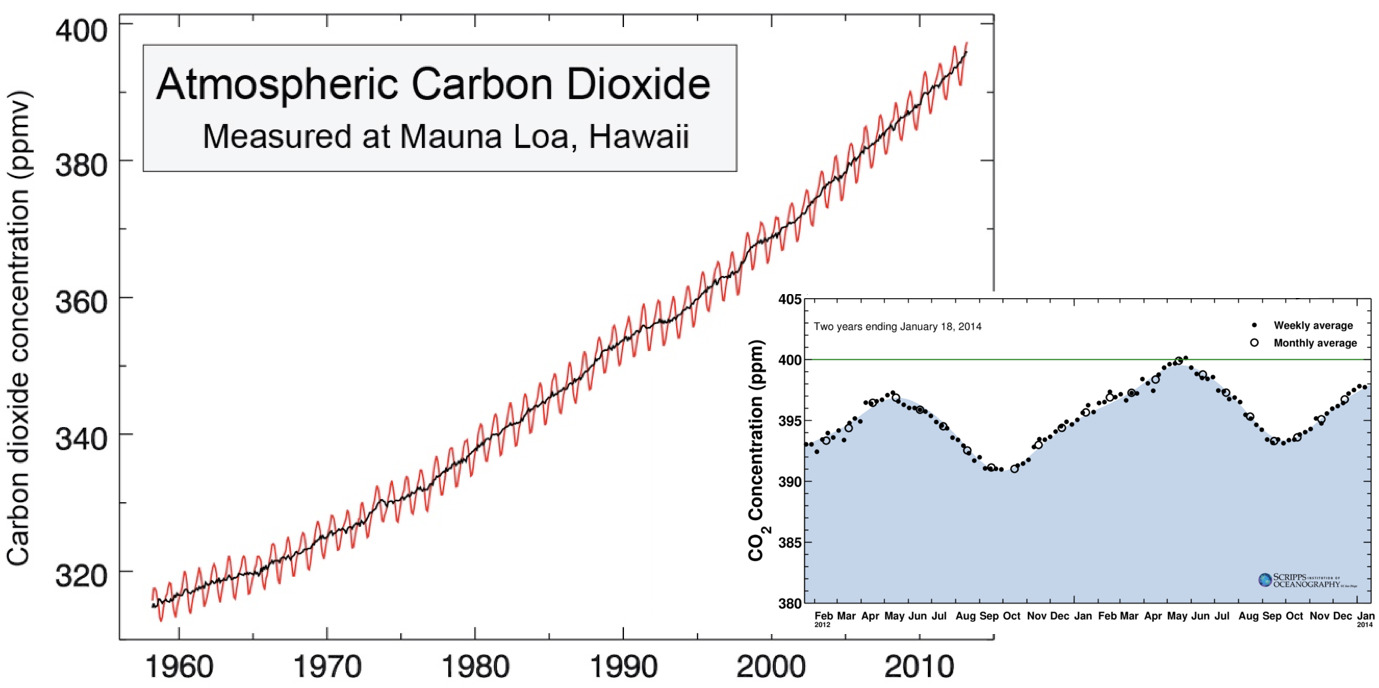
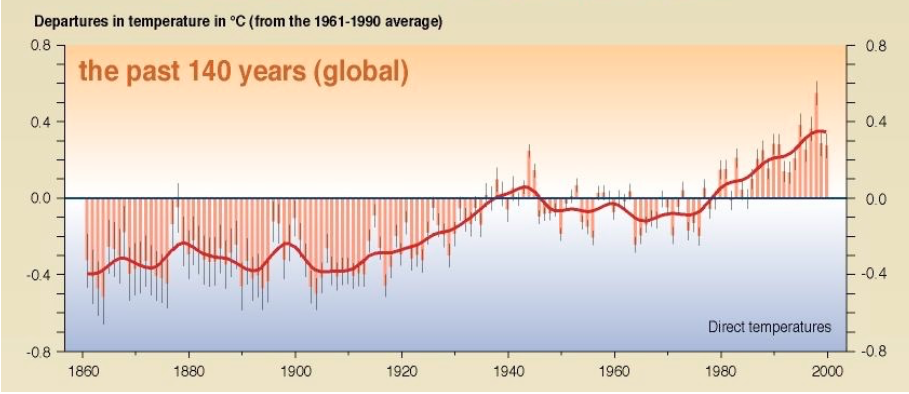
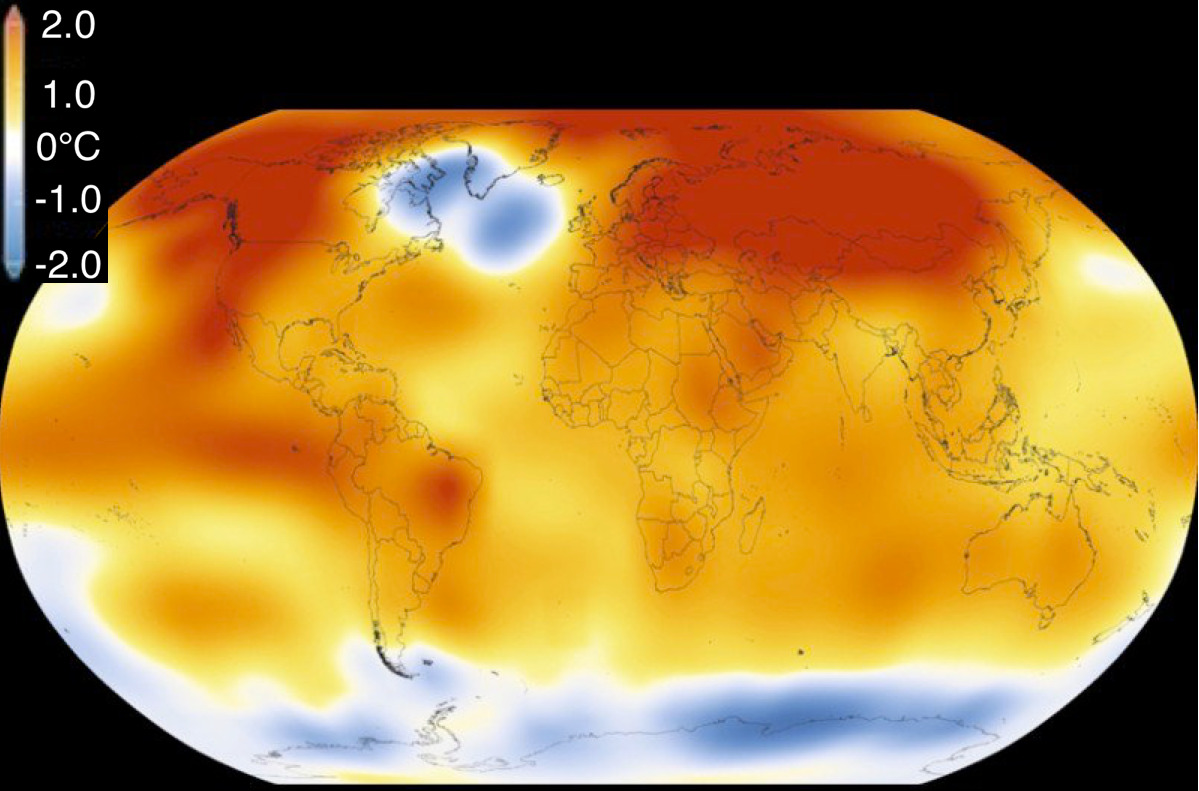
Climate Change And Sea Level RiseIncreasing atmospheric CO2 correlates with rising global temperature anomalies. Thermal expansion of warmed ocean surface water and melting of land-based glaciers contribute to sea level rise. Measurements of the carbon dioxide (CO2) concentration in Earth’s atmosphere have been carried out since 1958 at Mauna Loa, Hawaii (Fig. 17a). They show a significant increase in CO2 that correlates with a rise in global temperature anomalies over the same period (Fig. 17b). CO2 along with other so-called greenhouse gases, creates a thermal blanket that impedes heat escape from Earth’s atmosphere to space. Water vapor is the main greenhouse gas at low altitude, but CO2 dominates above the clouds, at the levels where Earth’s heat escapes to space. A warmer atmosphere means warmer ocean surface waters, and thermal expansion causes a volume increase of the warm water. The observed temperature increases are not uniform over the globe, but are greatest above the Arctic circle (Fig. F17b). Addition of melt water to the oceans from land-based ice and thermal expansion of ocean surface waters are the main contributors to current and projected global sea level rise.
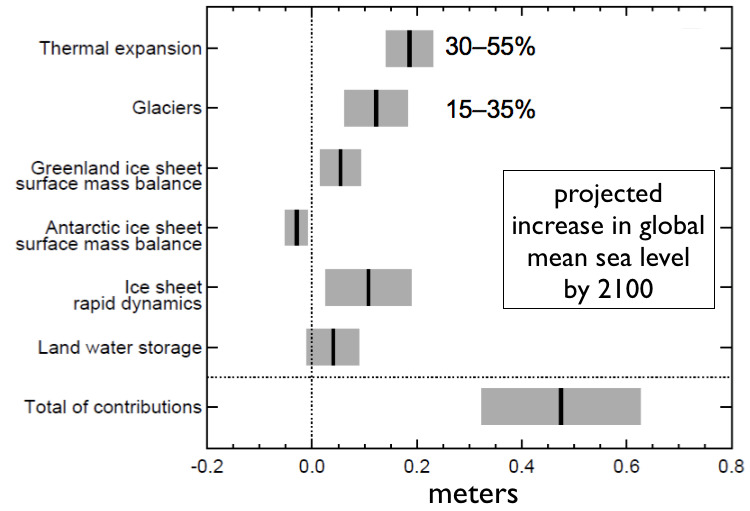
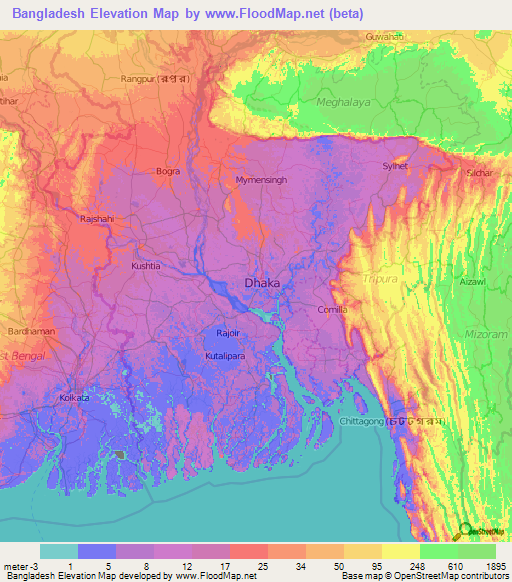
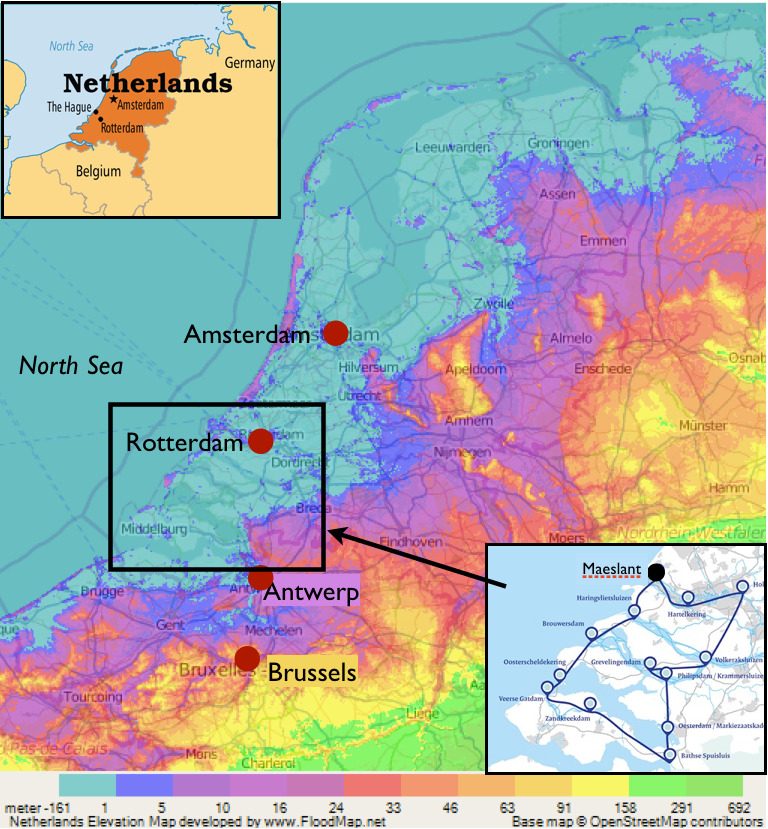
Sea Level Rise ConsequencesOver two thirds of Bangladesh is less than 20 m above sea level, as are many international cities. Estimates of expected global sea level rise in the next century vary considerably, but conservative estimates range from about 30 cm (about 1 ft) to 70 cm or even 100 cm (Fig. F18a). This may not seem like much to worry about, but in a country like Bangladesh it would be enough to permanently inundate the Ganges Delta region (Fig. F18b). Some estimates suggest almost 10 m in sea level rise for this century, although those estimates are not widely accepted at this time. Nonetheless, sea level rise is a topic of great concern for many countries. Half of the Netherlands is less than 1 m above sea level. Most of Singapore is less than 15 m above sea level. New Orleans has districts behind levees that are 2 m below sea level. In coastal California and in the south and southeast U.S.A., many cities will be affected by sea level rise of even the most conservative estimate. Other impacted cities include: Rio de Janeiro; Buenos Aires; Melbourne; Vancouver; Tokyo… the list is long. Coastal flood mitigation will certainly see greater global attention in the coming decades.
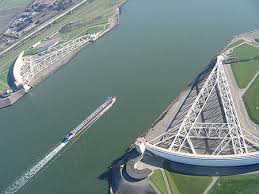
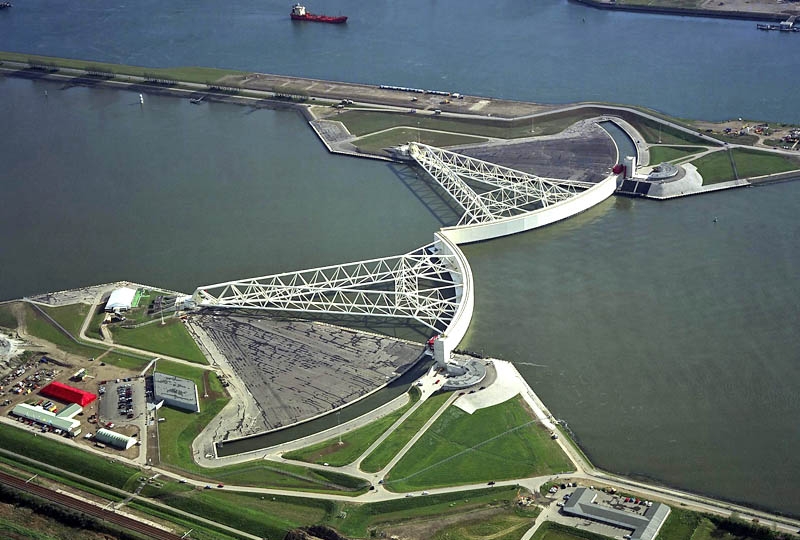
Tidal Barrier Flood ControlSeveral international cities are now building, or contemplating, tidal barriers against rising seas using the Netherlands as an example. The Netherlands provides an excellent example of a low-lying coastal region that has learned to manage river and sea flooding events. Almost two thirds of the country is below sea level (Fig. F19a). A farming system of polders and dikes (fields that are protected by levees) has existed since Roman times and has been mostly successful in controlling river flooding and tidal surge. However, in January 1953, a very high storm tide overran the coastal region, causing over 1,800 fatalities. As a consequence, Dutch engineers designed and built tidal barriers (Fig. F19b) to protect against storm tides. Recently, as part of an overall floodplain management program, the country has begun to lower the height of some of its river levees so as to allow farmlands to flood. Other low-lying regions around the world are looking to guidance from the Netherlands as they, too, try to protect their coastal cities from floods.
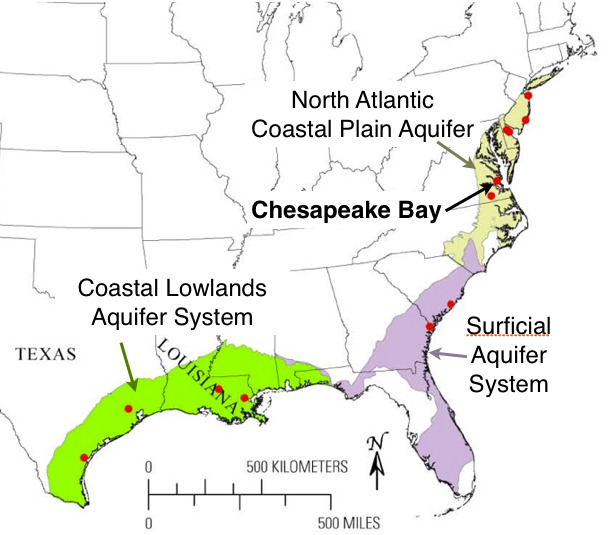
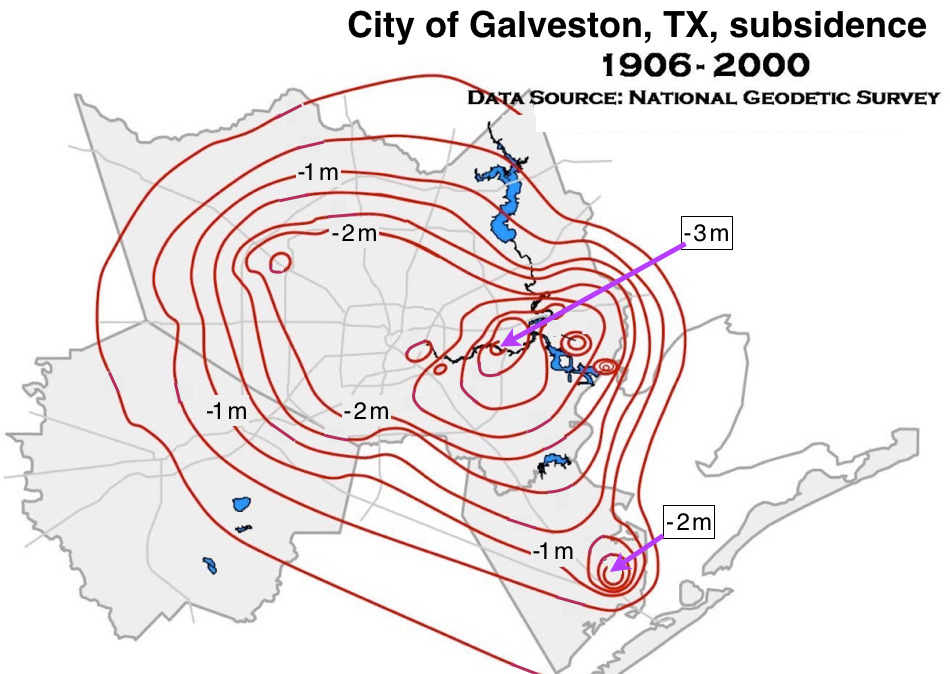
Sinking Land, Rising SeasLand subsidence from aquifer drawdown and concentrated property development compounds the impact of global sea level rise on coastal cities. Withdrawal of groundwater from an aquifer (buried layers of water-bearing rock or sand) allows the porous materials to compact and thereby creates a gradual subsidence of the ground surface above the aquifer. Ground subsidence from aquifer draw-down is of particular concern to coastal regions in the southern and southeastern U.S.A. (Fig. F20a), where mitigation of sea level rise must also take into account ground compaction beneath high building concentrations in cities and towns. For example, the City of Galveston, TX, has subsided by more than 2 meters (6 ft) and locally up to 3 meters just in the last century (Fig. F20b). Shanghai, China, is another coastal city that has sunk at least 2 meters since 1920. Other major coastal cities, including Bangkok, Jakarta, and New York, are facing similar predicaments.
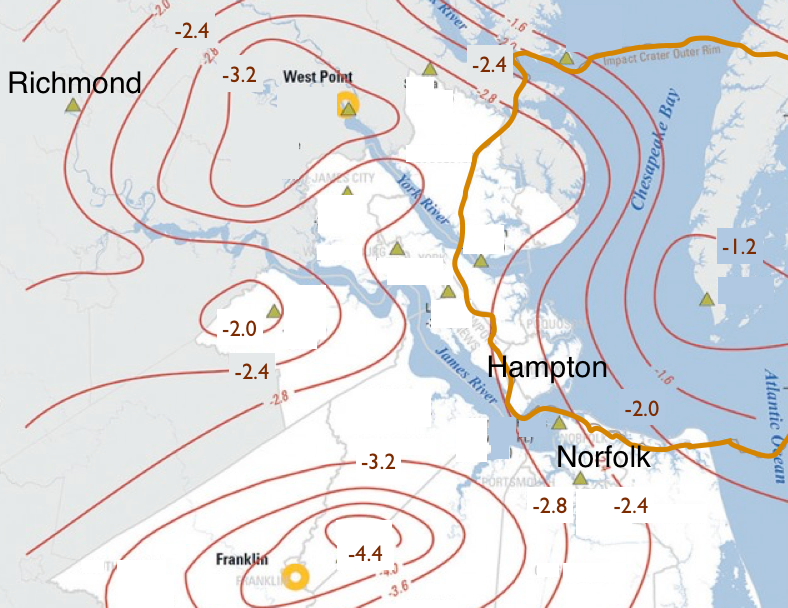
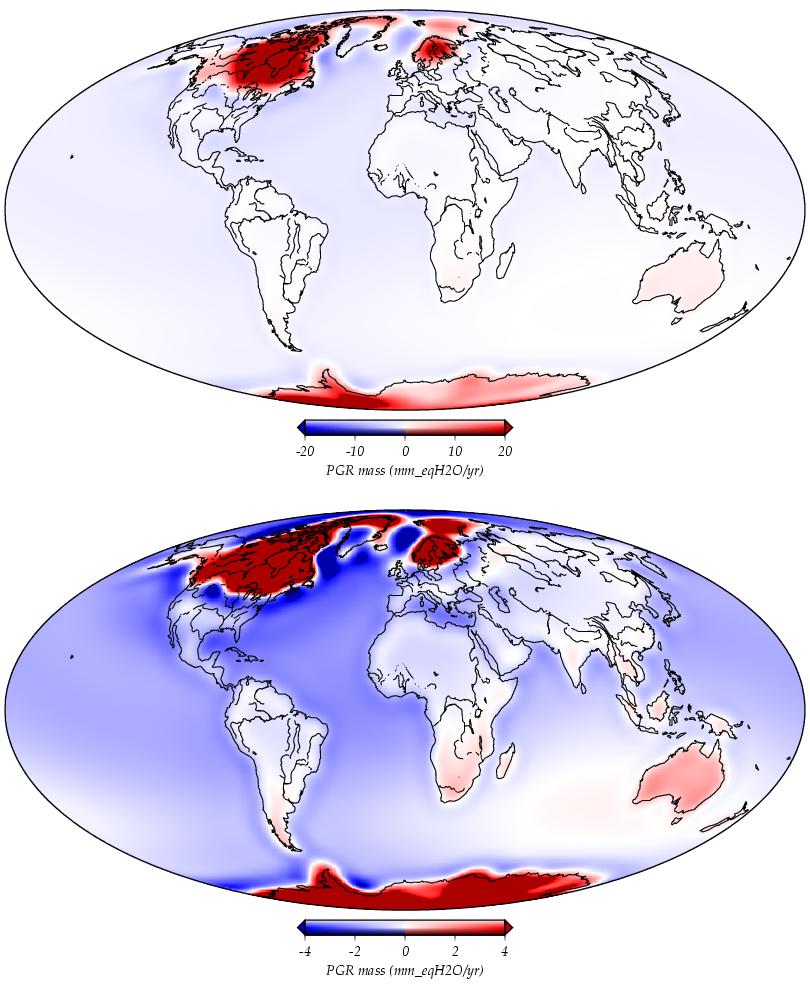
Post-Glacial SubsidenceSome land subsidence is caused by the Earth’s crust responding to the end of the last Ice Age. At the southern end of the Chesapeake Bay, in the mid-Atlantic coastal region of North America (Fig. F21a), the rate of land subsidence is accelerating at between 2 and 4 mm per year. Although this sounds like a very small increment of subsidence, by 2100 it will have added another 30 cms (roughly 1 ft) to the combined effect of aquifer draw-down, soil compression, and sea level rise on flooding vulnerability for the cities of Norfolk, Virginia Beach, and Hampton, among others. A substantial part of this subsidence acceleration is in response to the melting of northern ice sheets at the end of the last Ice Age. From New England northward, the regions of Earth’s crust that had been depressed under the mass of thick ice sheets during the Ice Age are slowly rebounding (rising in surface elevation) and, like a giant see-saw, the land to the south –which was not buried under ice – is slowly sinking (Fig. F21b).
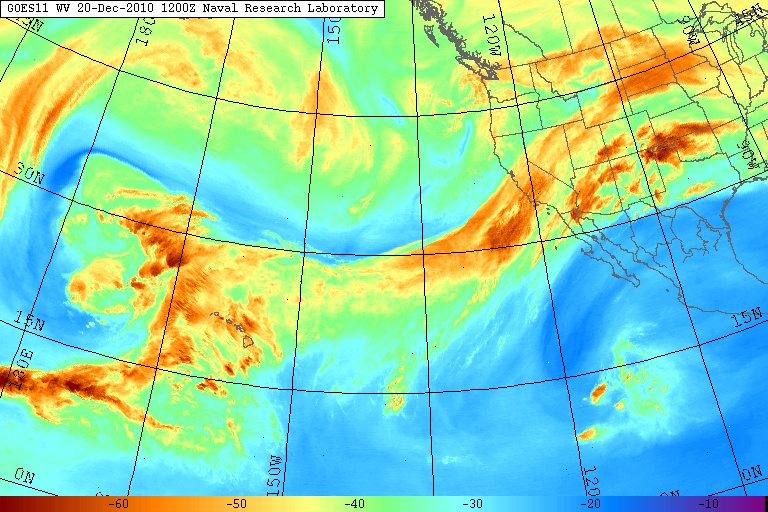
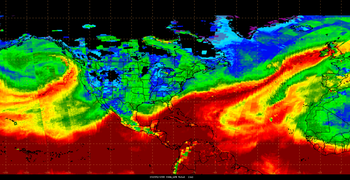
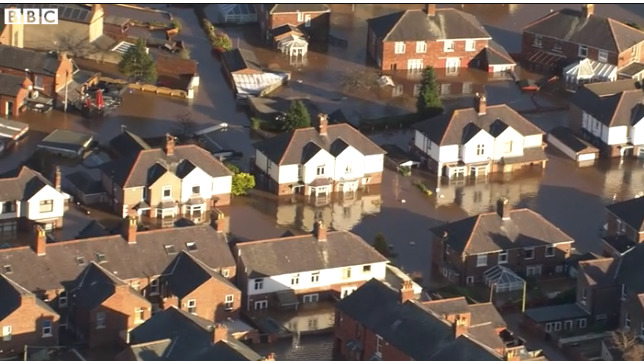
Atmospheric RiversLong, narrow plumes of atmospheric water vapor cause extreme precipitation and extreme flooding. The term ‘atmospheric river’ is a relatively recent name for narrow plumes of concentrated water vapor in the atmosphere that are thousands of km long, a few hundred km wide (Fig. F22a), and that can transport as much water as a large river on Earth’s surface. There are usually between 3 and 5 of these phenomena in Earth’s atmosphere at any one time, some much more intense than others. In December 2010, a large atmospheric river that stretched from the central Pacific to central California (Fig. F22a) produced more than 5 meters of snow in the Sierra Nevada mountains in just 5 days. Often dubbed ‘Pineapple Express’ because they originate near Hawaii, these atmospheric conditions are enhanced by strong El Niños. Another atmospheric river over the North Atlantic in December 2015 (Fig. F22b) was the cause of extensive flooding throughout Ireland, the northern U.K., and northern Europe (Fig. F22c).
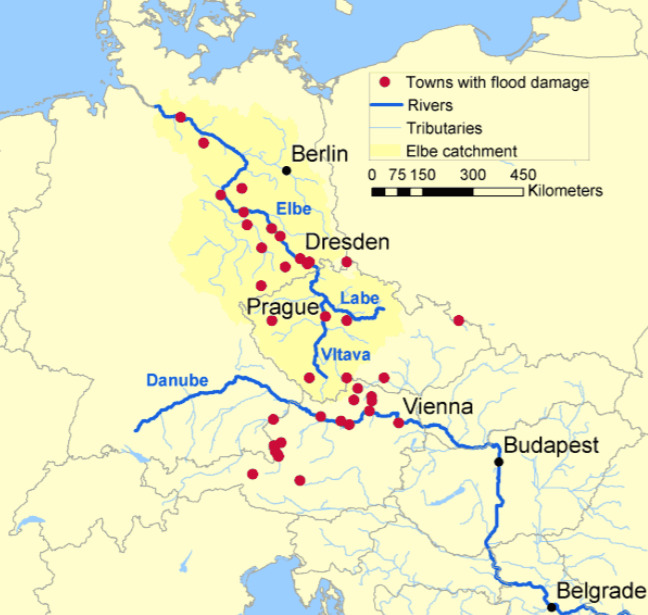
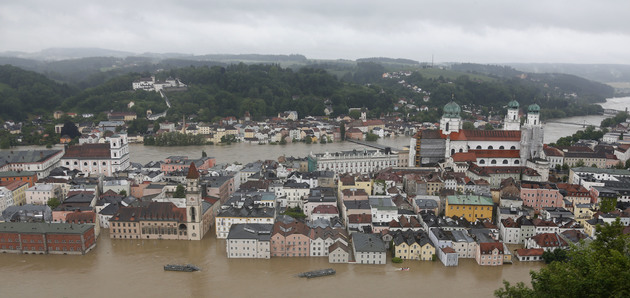
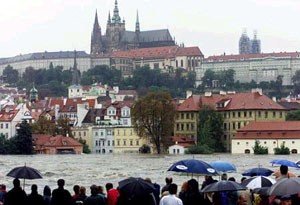
Floods In EuropeLarge regions of northern Europe have seen very destructive flooding in recent decades. Central Europe has been inundated by floodwater on numerous occasions in recent decades. Several of the region’s major rivers set record flood stage levels in 1954 when floodwater devastated towns in Austria, Germany, and what is now the Czech Republic. In August 2002, a week of continuous heavy rain in the eastern Alps caused extreme flooding all along the Elbe and Danube rivers (Fig. F23a) with more than 110 fatalities. The River Danube’s 1954 flood heights were surpassed in early June 2013 after 4 days of very heavy rain in the northern Alps, whose rivers drain into the Danube Basin. Prague, Passau (Fig. F23b), and other cities flooded. Again in December 2015, persistent intense rain from an atmospheric river fell over northern Europe, causing the evacuation of more than 50,000 people from Prague and surrounding regions as levees were breached and cities were again flooded (Fig. F23c).
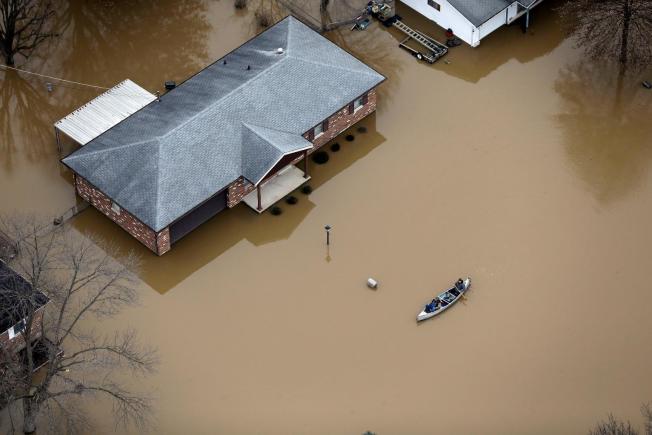
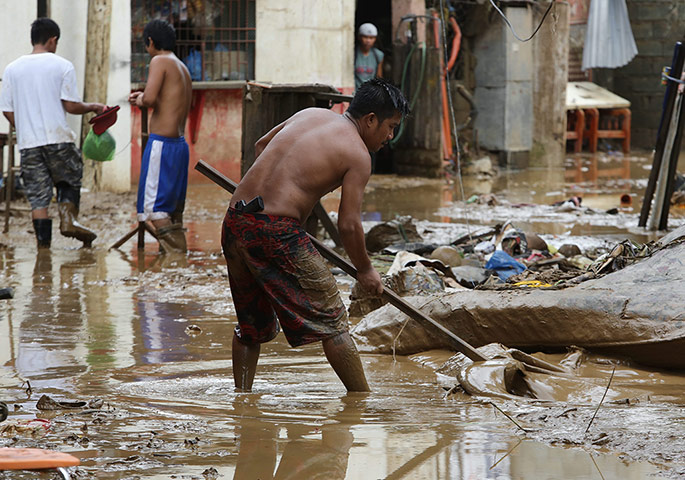
Flooding AftermathFlood waters carry silt, sand, gravel, uprooted trees and other, sometimes toxic, debris, which is all deposited when the discharge rate falls. When the discharge rate falls and flood waters finally recede, left behind are thick deposits of mud, which may include rocks, trees, vehicles, and other debris (Fig. F24a). If the water had picked up toxic chemicals, or other pollutants such as human or animal waste, that material also will have been deposited along with the sand and silt. Clean-up after a major flood is hazardous, expensive, and time-consuming. How long the flood waters persist on the surface is a function of the floodwater’s depth and the thickness and type of soil: clay-rich soils can take months to drain away all the excess water. Access to the area will be limited due to washed out roads and rails lines. Homes may be uninhabitable for days or weeks (Fig. F24b). Sewage lines may be broken or clogged. Survivors can be stranded without food or fuel, and, most importantly, without water that is fit to drink or even to use for washing.
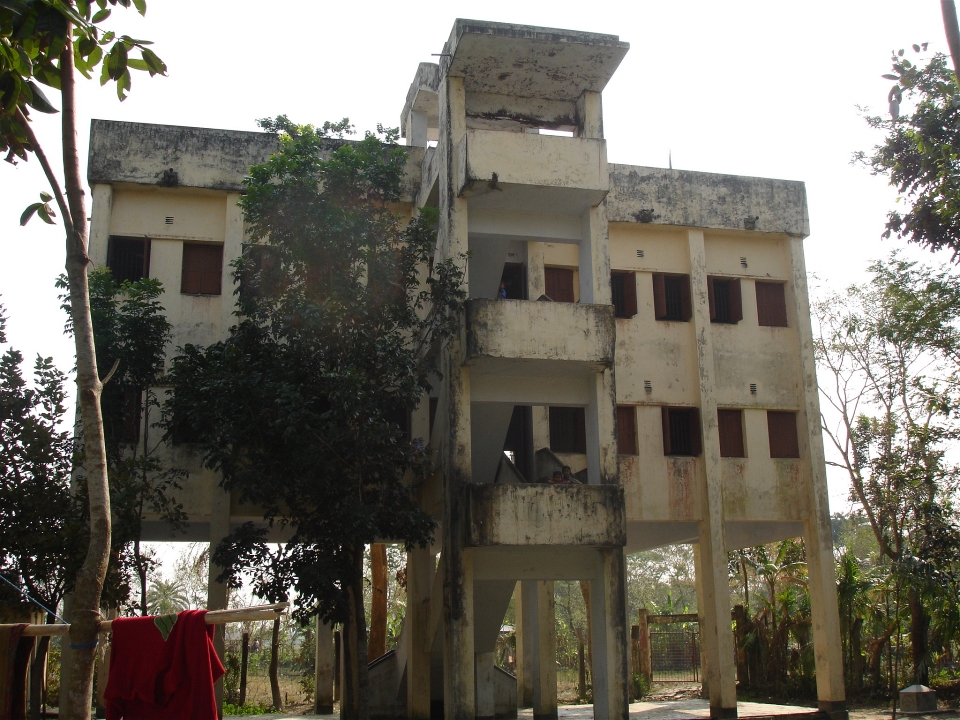
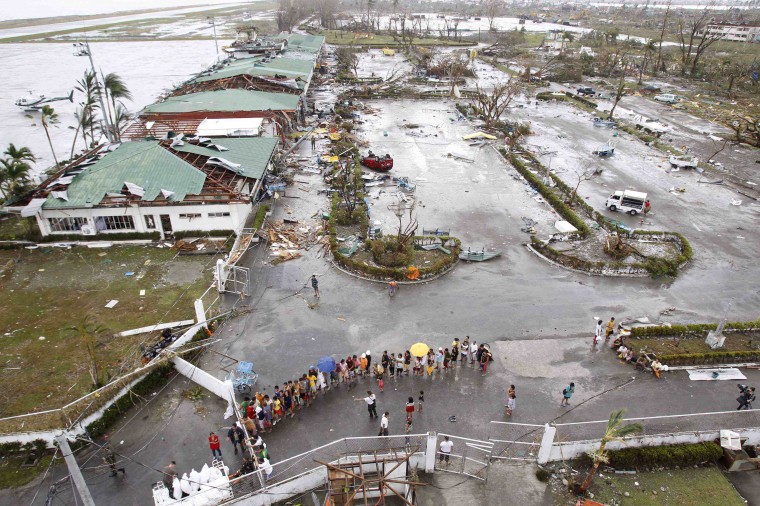
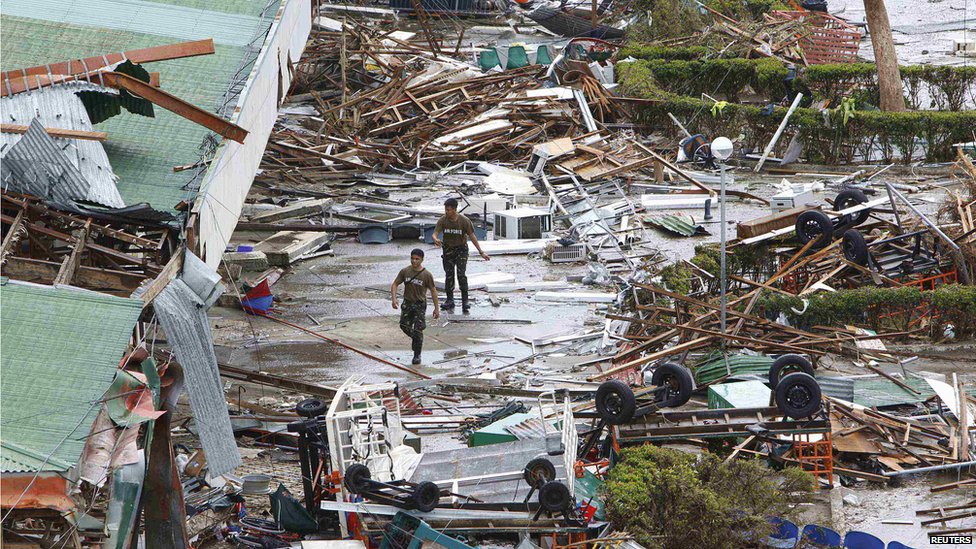
Storm SheltersStorm shelters, as long as they are elevated, are effective options for flood-prone regions. In 1970, more than 300,000 died in one of the worst natural disasters of recorded history when floods caused by Tropical Cyclone Bhola impacted the Ganges Delta region. The number of direct versus indirect fatalities caused by the storm remains controversial, but the devastation led Banglasdesh to build elevated cyclone shelters (Fig. F25a) and to create emergency preparedness plans to reduce the impact of flooding from tropical cyclones. Storm shelters are not always effective and may even add to the death toll if they are not elevated above river flood crest or storm surge heights. In November 2013, many people on Leyte Island in the Philippines took refuge in schools and government buildings – structures that were meant to act as storm shelters – to avoid Typhoon Haiyan. However, Haiyan’s 5 m-high storm surge flooded these buildings (Fig. F25b), adding to the number of fatalities caused by the storm.
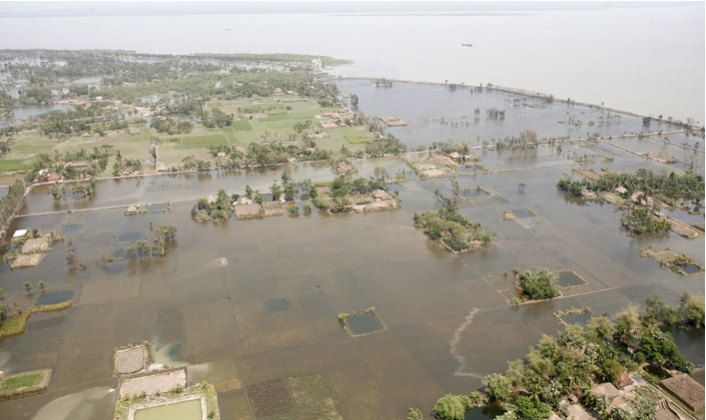
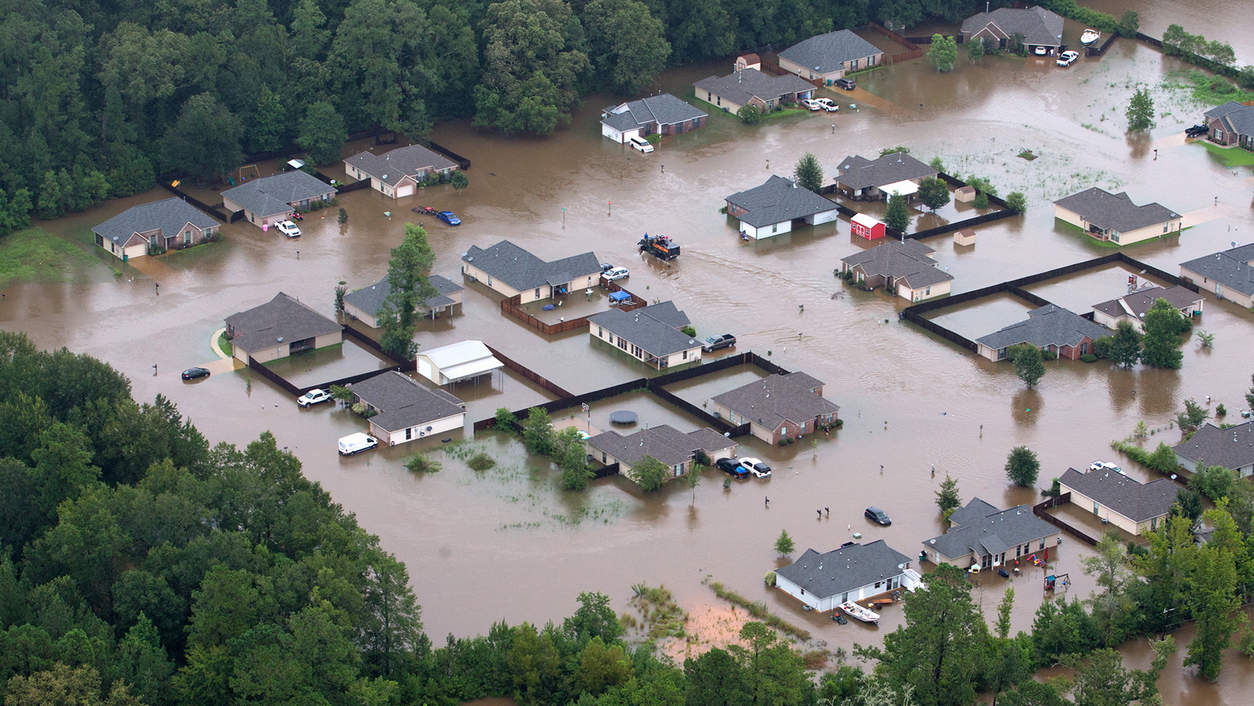
Evacuation Saves LivesEarly warning and evacuation procedures move vulnerable populations away from flood zones. When Tropical Cyclone Aila struck Bangladesh and eastern India in 2009, the evacuation of thousands of people from the storm’s path saved an incalculable number of lives. The total death toll caused by Aila was under 200, even though an estimated 2.3 million people were affected by the floods, which submerged towns, villages and large regions of agricultural lands (Fig. F26a). In October 2013, when Cyclone Phailin hit southeastern India, destroying towns, crops, and critical infrastructure, India’s early warning system allowed the evacuation of over 1 million people, with the result that fewer than 20 floodrelated fatalities occurred. A larger cyclone in the same region in 1999, when there was not yet an adequate warning system in place, killed 15,000 people. Similar results have been seen worldwide, including in Louisiana in August 2016 (Fig. F26b): the evacuation of people from imminent or actual flood zones saves innumerable lives.
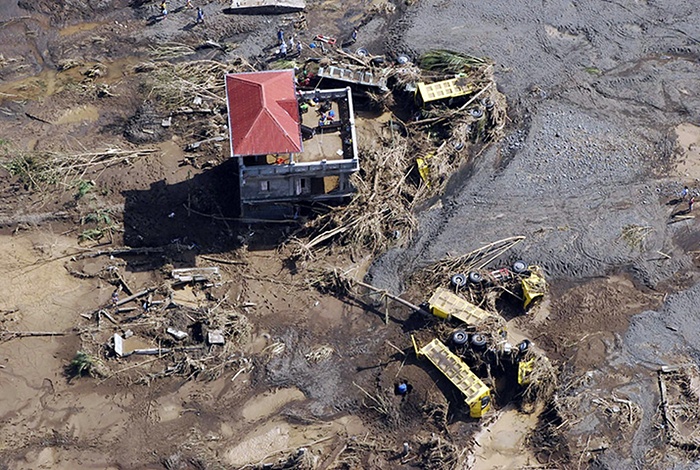
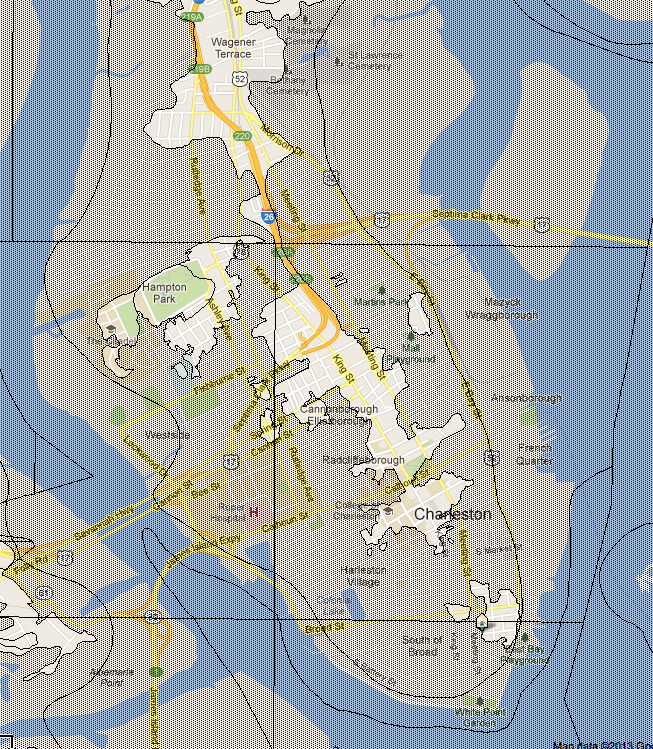
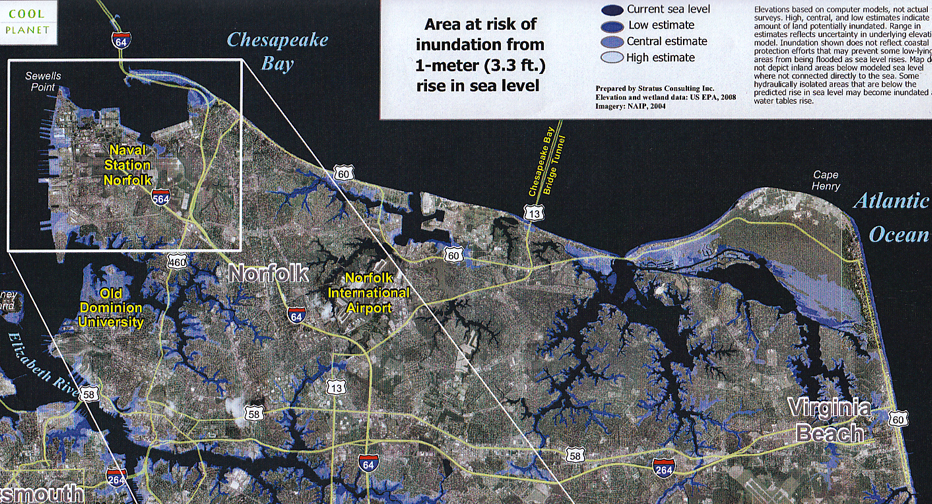
Population Relocation?If frequent flooding cannot be avoided, should entire populations be relocated? To anyone who does not live and work in a region that is prone to flooding, it might seem logical to relocate the affected population away from the coast or river that is causing the problem. Some towns are taking this approach, such as the town of Grantham on the Lockyer Valley floodplain in Queensland, Australia, which was devastated by a flash flood in January 2011 (Fig. F27). Residents of the region are being given the opportunity to relocate to higher ground through a voluntary land-swap initiative. Other cities and towns in Australia and elsewhere around the world are restricting new or replacement development in floodplains and requiring existing homeowners and businesses to obtain flood insurance. Unfortunately, not all vulnerable populations have the option to move. Island nations such as the Philippines, cities on low-lying coastal plains such as Norfolk, Savannah, and Charleston on the U.S.A.’s east coast, countries with agrarian economies such as Bangladesh, and very large cities such as Miami, Jakarta, New York, or Dresden, are not able to permanently relocate their residents away from potential flood risk. Their approach instead is to mitigate as much risk as possible by having well thought-out monitoring and evacuation plans, storm shelters, and flood prevention programs.
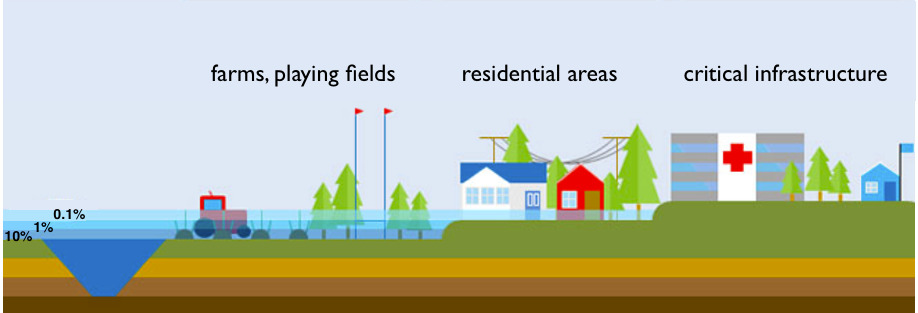
Designated Flood ZonesCities around the world are creating flood zone maps that show the probability of future flooding. Designated flood zones are regions that the U.S. Federal Emergency Management Agency (FEMA) has calculated are likely to flood under certain conditions. They are used to alert property owners of risk and to determine flood insurance rates:
Many cities and towns around the world have developed flood inundation risk maps (Figs. F28a, b), using data from past events and sea level rise predictions to assess the probability of future flooding. These flood zone maps are used for future development planning, flood mitigation, and emergency preparedness planning.
Floodplain ManagementAllowing river floodwater to access its floodplain can help prevent flooding of towns and cities. In its natural state, excessive surface runoff would cause a river to overtop its banks and spread over the floodplain. However, few rivers are still in their natural state. Levees, dams, and other engineering constructions are designed to direct water to where humans would prefer it to be. Relocating people out of floodplains would help prevent flooding disasters, but where this is not feasible, a more practical solution is floodplain management (Fig. F29a), which includes:
|